In this article
Replenishment Out of Stock Overview Charts
The Replenishment suite comes with a series of Replenishment Out of Stock Overview Charts and a Replenishment Sales Chart, which provide a graphical overview of the inventory status and out of stock situations of the items over a specified period of time.
Replenishment Out of Stock Overview Charts
The Replenishment Out of Stock Overview Chart can be used to visualize how the out of stock situations are distributed across the different item groups and locations. The chart shows the distribution of the Replen. Out of Stock Logs by percentage, based on the setup and filters that are applied in the Replen. Out of Stock Overview lines.
To access the Replenishment Out of Stock Overview Chart:
- Click the
 icon, enter Replen. Out of Stock Overview, and select the relevant link.
 - Select a record on the Replen. Out of Stock Overview page.
- Click Actions - Show Chart by, which will bring up a submenu that lets you choose how the chart should be visualized. The available options are:
| Action | Description |
|---|---|
| Division | Open the Replen. Out of Stock Overview Chart page, which displays a pie chart showing the distribution of the out of stock occurrences by percentage, based on the filtered Out of Stock entries grouped by Division. |
| Item Category | Open the Replen. Out of Stock Overview Chart page, which displays a pie chart showing the distribution of the out of stock occurrences by percentage, based on the filtered Out of Stock entries grouped by Item Category. |
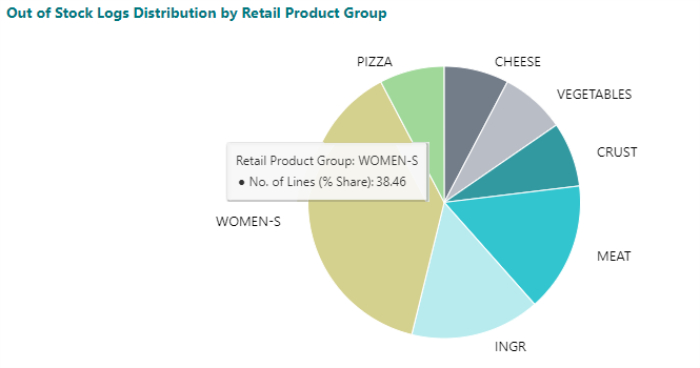
| Retail Product Group | Open the Replen. Out of Stock Overview Chart page, which displays a pie chart showing the distribution of the out of stock occurrences by percentage, based on the filtered Out of Stock entries grouped by Retail Product Group. |
| Location | Open the Replen. Out of Stock Overview Chart page, which displays a pie chart showing the distribution of the out of stock occurrences by percentage, based on the filtered Out of Stock entries grouped by Location. |
The % share of the chart is computed according to the number of Replen. Out of Stock Logs within each category against the total, based on the setup and filters applied in the selected Replen. Out of Stock Overview line.
The following is an example of a Replenishment Out of Stock Overview Chart, showing the distribution of the Replen. Out of Stock Logs grouped according to Retail Product Group:
Replenishment Sales Chart
The Replenishment Sales Chart provides a graphical overview of an item's sales pattern, as well as its inventory movement and out of stock situations over a specified period of time. For certain calculation types, the chart also provides an estimated demand forecast for the item. The Replenishment Sales Chart is accessible from the Replen. Out of Stock Days page for a selected item, variant, and location.
To access the Replenishment Sales Chart from the Replen. Out of Stock Days page:
- Click the icon, enter Replen. Out of Stock Overview, and select the relevant link.
- Select a record on the Replen. Out of Stock Overview page.
- Click Functions - Show Lines, or alternatively, click the value of No. of Lines of the selected record to open the Replen. Out of Stock Days page.
- Select a record on the Replen. Out of Stock Days page.
- Click Show Sales Chart to open the Replenishment Sales Chart, which will be filtered to the item, variant, and location of the selected Replen. Out of Stock Days record by default.
For more information see Replenishment Sales Chart.