The installation package that you extracted to the Base folder includes a Power BI templates folder with five templates that can now be connected to the SQL database created in Azure by the DeploymentScript.ps1.
The Power BI template files are named:
- Actionable Insights.pbit
- Hotel Analytics.pbit
- Inventory Analytics.pbit
- Sales Analytics.pbit
- Supply Chain Analytics.pbit
Note: The Hotel Analytics template will only work if you are running the LS Central for Hotels extension (available for version 15.3 and later) in your LS Central instance.
Connect Power BI template with Analytics database
-
Now open one of the template files, for example the Sales Analytics template. You need to repeat the following steps for each report template you want to load and publish to the Power BI cloud service.
Note: You can find the information for the next two steps in the Parameters.json file that was created in the Analytics deployment and saved with the project setup files.
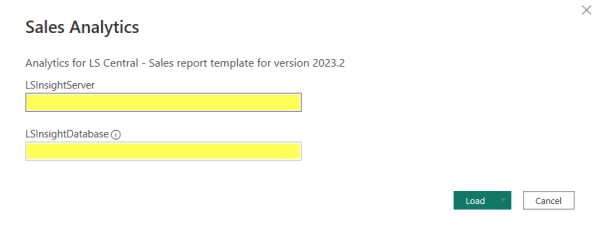
- Enter Server and Database information from Parameters.json, and click Load:
- LSInsightServer = LSInsight - Server - FullyQualifiedDomainName for example:
lsinsight-dev-skynet.database.windows.net
- LSInsightDatabase = LSInsight - Database - Name for example:
- Analytics-v20232-ji
- LSInsightServer = LSInsight - Server - FullyQualifiedDomainName for example:
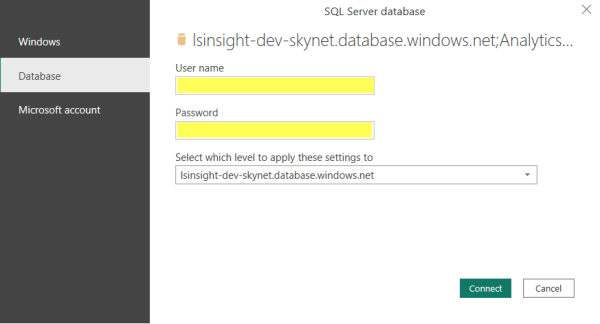
- Enter the login information for the database and click Connect:
-
User name = LSInsight - Server - UserName from Parameters.json
-
Password that you selected for the Analytics server admin
Note: You will not see any data at this stage as firewall rules block direct access to the data in Azure from the local network. Once uploaded to the Power BI service, you will have access to your data. If you still cannot see any data after you upload, it might be because the pipelines have not run. You can always manually trigger the pipelines, if needed.
- Save your report and name it for example Sales Analytics. This will be the name of the dataset and report after you upload the report to the Power BI service.
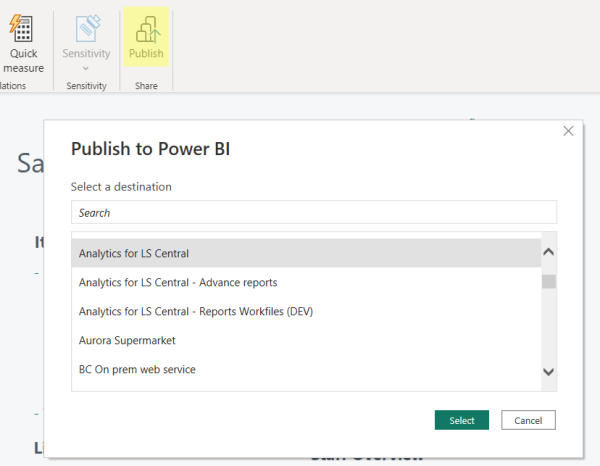
- Publish the report to the Power BI service. We recommend that you create a workspace for the report and publish to that workspace (optionally, you can create a test workspace and try out the product and updates there).
Tip: If any of the visuals in the Power BI report are not visible when you view the report in Power BI desktop, you might need to turn on some preview features. You do that by navigating to File > Options and settings > Preview Features and selecting Smart narrative visual and Data point rectangle select.
Set up the Gateway connection
Because you have set up Analytics on an on-premises SQL server, you need to create a gateway connection so Power BI service can communicate with the on-premises Analytics database.
- In your workspace, go to the Datasets menu.
- For the Analytics dataset, click the (…) under Actions and select Settings.
- Expand Gateway Connection.
- If Gateway has not been set up, the expanded Gateway connection section will look like this and you will need to set up a new gateway. You can do this either by going to the Manage Connections and Gateways or select the Install now button to install a personal gateway.
Note: The gateway should be installed on a machine that is on the same domain as the source for the report. That is a machine that is on the same domain or has access to the machine where the Analytics database is located. If you need more information on how to set up a gateway, you can press Learn more and consult the Microsoft Dynamics 365 Business Central documentation.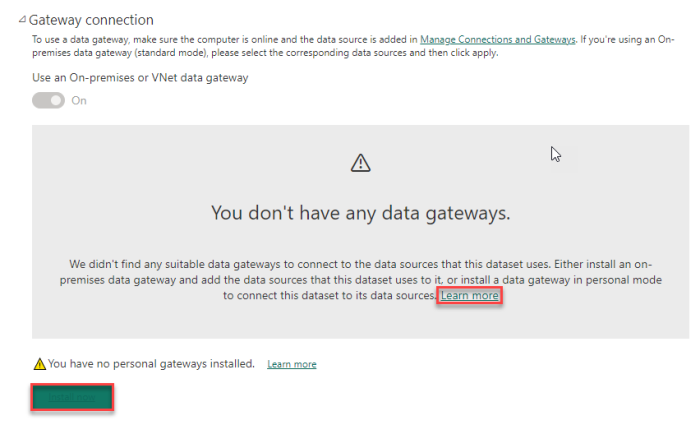
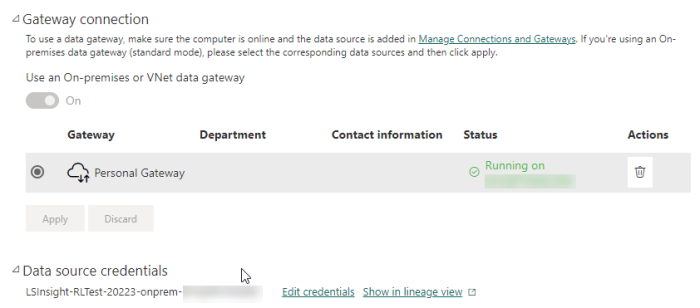
- When you are done setting up the gateway, you might need to refresh the credentials, but once you have entered the credentials to connect to the database, the Gateway Connection and Credential sections will look like this and you can proceed with setting up the scheduled refresh:
Set the schedule refresh in Power BI
You can always click the Refresh button to load current data to the dataset. However, as all the data is loaded on each refresh, it can take a few minutes to load. It is therefore recommended to set a refresh schedule on the dataset. This is done in the dataset settings:
- In your workspace, go to the Datasets menu.
- For the Analytics dataset, click the (…) under Actions and select Settings.
- Expand Scheduled refresh.
- Enable schedule refresh by turning the Keep your data up to date option to On.
- Set the Refresh frequency and Time.
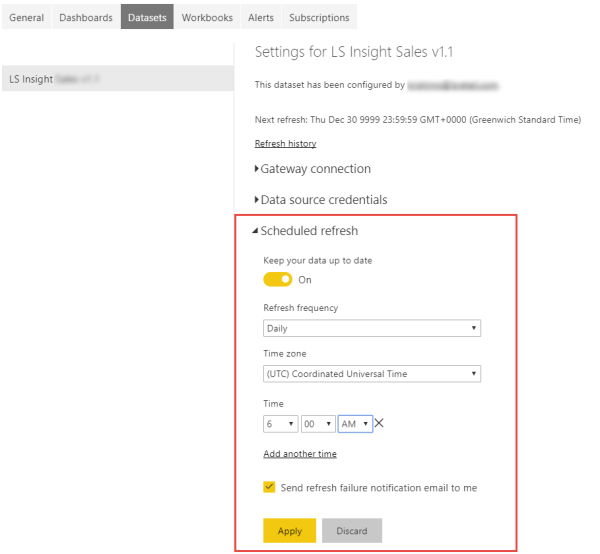
Note: In the current version it is not possible to automatically trigger Power BI to refresh after the data warehouse has been updated (this will be available later). Therefore, you will need to have the Power BI refresh the time set to refresh at minimum 2 hours after the ADF pipelines start (you can also add additional time to make sure). In the example we have been using this would be at 3 a.m. since the ADF pipelines start at 1 a.m.
- Now you are all set up and ready to go.
Note: Depending on the data size, the initial load can take a long time. You can monitor the process in Azure, but be prepared to wait a few hours before data can be visualized in the Power BI reports.
Dataset items
If you are curious or have questions about the visible items in the Analytics dataset from the Power BI Templates, it is a good idea to review them.