About This Release
Released - May 25, 2023
In this version of Analytics the focus has been on changing the Azure data factory deployment process and adding new fact tables and reports for Tenders from POS and POS transactions that are not sales. Reports for special groups and item family were also added and item family and special groups were added as selection parameters in dynamic reports. Hotel Analytics template was also updated and new report pages added as well as revenue for transactions not connected to reservations.
This version of Analytics for LS Central supports versions 8.4 and later of LS Central On-premises and later versions of LS Central SaaS. Setup of Analytics for LS Central SaaS needs some additional setup from the standard Analytics onboarding process which is explained in detail in the onboarding documentation.
Note: Updates for version 2023.2 is provided in a special update package. If you have already set up version 2023.2, you can update to 2023.3 without creating a new instance of Analytics. See update guidelines for more information.
Note: If you have customizations in your Analytics instance, you need to make sure before you start that the updates do not affect these customizations.
The following is a list of changes and key features in Analytics version 2023.3.
New or Enhanced Features
Setup
Product package
Bicep deployment of Azure Data Factory
Instead of the arm template files, the arm_template folder now contains the .bicep files used to deploy and the Azure Data Factory. The InstallBicep.ps1 has also been added to the Product package.
- InstallBicep.ps1
- arm_template folder
- analytics_adf.bicep
- bicep_template_parameters.json
- create_adf.bicep
- create_AnalyticsDWLinkedService.bicep
- create_custom_fact_pipelines.bicep
- create_datasets.bicep
- create_dim_pipelines.bicep
- create_hotel_pipelines.bicep
- create_integration_runtimes.bicep
- create_LSCentralSourceLinkedService.bicep
- create_metadata_pipelines.bicep
- create_pipeline_run_diagrams.bicep
- create_staging_pipeline.bicep
- create_standard_fact_pipelines.bicep
- create_triggers.bicep
Prestaging table creation scripts
Prestaging scripts have been added to for the following LS Central tables:
- LSC Tender Type
- LSC Tender Type Card Setup
- LSC Trans_ Payment Entry
- LSC Item Variant Registration
And modified for the following tables:
- LSCHT Detailed Revenue Entry_
- LSCHT Hotel Res_ Entry_
- LSCHT Room Blocking Entry_
- LSCHT Room Type Block_
Scheduler job header file
The Scheduler header file has been updated to include subjobs for the new prestaging tables:
- LSC Tender Type
- LSC Tender Type Card Setup
- LSC Trans_ Payment Entry
- LSC Item Variant Registration
Scheduler job header Hotels file
Hotel Scheduler job header file has been updated to include subjobs for the changed prestaging tables:
- LSCHT Detailed Revenue Entry_
- LSCHT Hotel Res_ Entry_
- LSCHT Room Blocking Entry_
- LSCHT Room Type Block_
Documentation
Section on installing Bicep has been added to the onboarding documentation.
Azure Data Factory
Deployment
We have changed the way we ship and deploy the Azure data factory for Analytics. We used to ship ARM templates, but now we are using bicep files. This change makes it easier to manage the data factory in code as well as minimizing risk of bugs in deployment. This change also enables us to update specific parts of the data factory during updates, instead of overwriting the whole data factory like we do now with the ARM templates.
The bicep files can be broken into three main categories:
- analytics_adf.bicep is the "main" file and controls the deployment.
- bicep_template_parameters.json is the parameter file which is populated during deployment and used by the main file.
- The rest of the files are to create different modules of the data factory, f.ex.:
- Linked services and integration runtimes
- Meta data pipelines
- Staging pipelines
- Fact pipelines
- Triggers.
When updating an existing data factory, there are only two scripts:
- update_analytics_adf.bicep which is the main file.
- adf_changes.bicep which includes all changes to the data factory for the release.
In order to install bicep, we have added a PowerShell script with code from Microsoft learn, InstallBicep.ps1. You will need to run this script once, after you have installed the Az module.
Pipelines
Two new pipelines were added to the standard fact pipelines module in Bicep:
- PL-SP-factPOSPayments
- PL-SP-factPOSTransactions
Data Warehouse
Database
Tables
Sales type description column has been added to FactSalesPosted. This has been added as a filtering option in the sales report.
New columns were introduced in dItem table:
- Hard attribute fields were added to Item dimension. These columns can now be used as filters on items, when needed. Hard attributes are sometimes used for brands and other attributes on items.
- Hard Attribute 1 Code
- Hard Attribute 2 Code
- Hard Attribute 3 Code
- Hard Attribute 4 Code
- Hard Attribute 5 Code
-
Purchase dates were added to Item dimension:
- First Purchase Received
- Last Purchase Received
-
Unit Price and Cost from stg$Item table were added:
- Unit Price
- Unit Cost
Variant dimension fields were added to Variant dimension. Six new columns were introduced in dItemVariant table:
- Variant Dimension 1
- Variant Dimension 2
- Variant Dimension 3
- Variant Dimension 4
- Variant Dimension 5
- Variant Dimension 6
SK_Variant field was added to fPurchaseOrder fact table.
Two new fact tables were added using the listed staging tables:
-
fPOSPayments
- LSC Tender Type
- LSC Tender Type Card Setup
- LSC Trans_ Payment Entry
-
fPOSTransactions
- Transaction Header (This table already existed in the DW so no new staging or prestaging tables needed to be added)
The staging tables have also been added to LSInsight$SourceTablesMap.
Changes in Hotel tables
-
New source tables from LS Central have been added to LSInsight$SourceTablesMap, but staging table names have not changed.
- LSCHT Detailed Revenue Entry_ -> Detailed Revenue Entry
- LSCHT Hotel Res_ Entry_ -> Hotel Res_ Entry
- LSCHT Room Blocking Entry_ -> Room Blocking Entry
- LSCHT Room Type Block_ -> Room Type Block
-
Entry No_ field has been renamed to Line No_ in the following tables:
- fHotelDetailedRevenue
- fHotelReservationEntry
- fHotelRoomBlockedEntry
-
Renamed the Company column in dHotelRooms table to SK_Company.
-
Added the SK_POSTerminal column in fHotelDetailedRevenue to connect to the POS Terminal dimension.
Stored procedures
- factSalesPosted - stored procedure was updated to include Sales Type from POS transactions.
- mergedItem - stored procedures for all versions were updated to populate new fields.
- mergedItemVariant - stored procedure was updated to populate new fields.
- factPurchaseOrder - stored procedure was updated to populate new field.
- All factHotel... procedures were updated because of changes in column names and primary keys.
- Added sales transactions which are not connected to a reservation to fHotelDetailedRevenue
- Two new stored procedures were added for loading of data to the new fact tables:
- factPOSPayments
- factPOSTransactions
Reports
Sales Analytics
Tender Types
A new section of report pages has been added to the Sales Analytics report, called Tender Types.
These pages show the amount tendered from the POS by tender types and currencies. You can filter the data by stores, customers, members scheme, members, and transaction type.
_800x450.png)
_800x448.png)
POS Transactions
A new page has been added in the Sales Analytics report called POS Transaction Overview, it shows POS transactions which are not completed Sales transactions, for example 'open drawer', 'remove tender', 'voided sales' and more. If you want to see log on and log off, you need to activate 'register logon/logoff' in the POS Functionality Profile.
The page shows the number of these transactions by time or date in the graph, and in the table you see it by transaction type and can drill down to store, POS terminal, and staff. We made a small change on the left side of the report, for example if you select a transaction type in the table, it will filter all other visuals also the left side. This was done so it would be easier to see what staff or stores are effected. We also added the possibility to filter on transaction types in a drop-down menu above the table (see image).
![]()
Item Family
New report page, similar to the Item Categroy page, that shows sales by item family was added, and is accessible from navigation page and menu.
Special groups
New report page, similar to the Item Categroy page, that shows sales by special groups was added, and is accessible from navigation page and menu.
Supply Chain Analytics
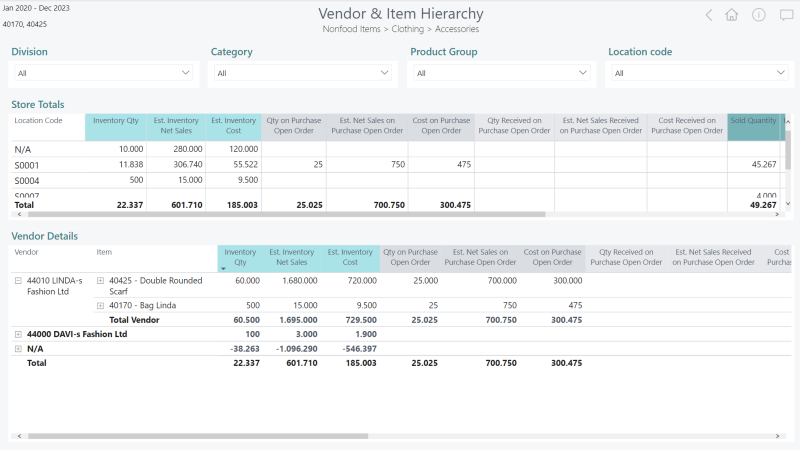
New report pages have been added to the Supply Chain Analytics report template. These pages show combined data from Sales, Inventory, and Supply Chain reports. These are tabular reports showing status on inventory, purchase orders, and sales for item, product group, category, division, and more.
Each of the report pages has filters or slicers at the top at the page: Division, Category, Product Group, and Location code. These will filter the data on the page and the filters or slicers are synced with other pages in the report. There are also huge varieties of other filters in the filter pane, such as item, vendor, season, five hard attributes, six item variants, variant framework, first and last purchase receive date.
The columns in the tables are color coded to help distinguish between the measures:
- Light blue shows values for Inventory.
- Grey shows values for Purchase orders.
- Green shows values for Sales.
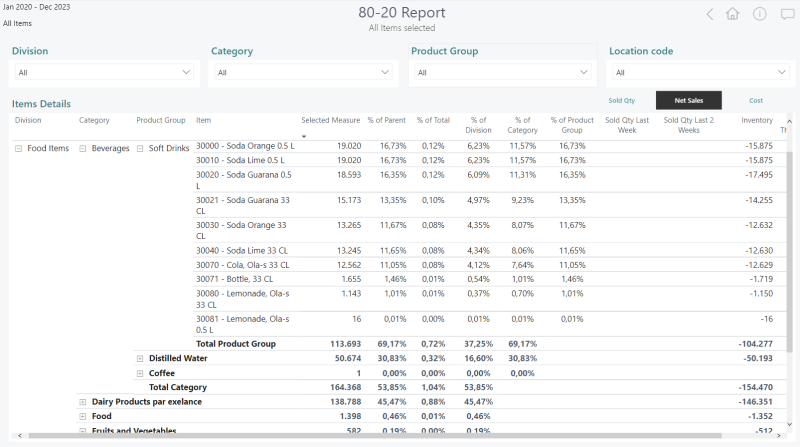
One page in the report is called 80-20 Report. It shows item hierarchy by Net Sales, Sold Qty, or Cost, and highlights the lines where the item is a part of 80% of Net Sales, Sold Qty, or Cost.
When filters or slicers are used, it will re-calculate the 80% due of updated total number. For example:
In the first image there is no filter set and when viewing Division: food items, Category: beverages, Product Group: soft drinks there is nothing highlighted. Meaning soft drinks items are not contributing to the top 80% of total net sales.
In the second image a filter is set on Category: beverages. Now you see highlighted lines in the Product Group: soft drinks. The reason is that the report is calculating the 80% of the total for Category: beverages. Now the items in Product Group: soft drinks that are contributing to 80% of net sales of Category: beverages are highlighted.
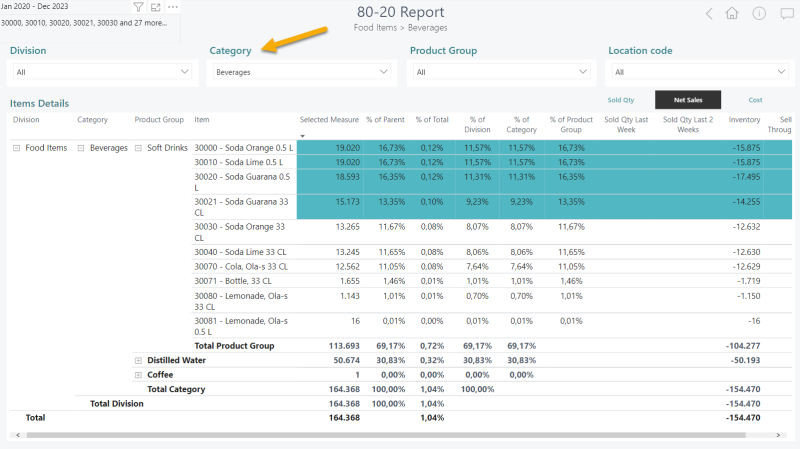
There is a possibility to change the % (switch from 80% to 70%) for this report page. We recommend to change it in Power BI desktop version. Find a table called ABC Classes and find field called Class, there you can change the %.
If you need any further explanation on the fields or measures in the new report pages, you can see documentation in the dataset items and bus matrix report.
Hotel Analytics
New report pages
Four new pages have been added to the Hotel Analytics report.
- Revenues (Items)
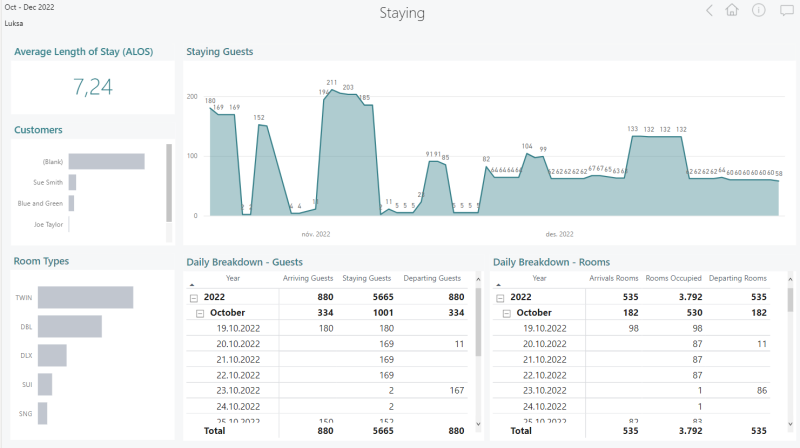
- Staying
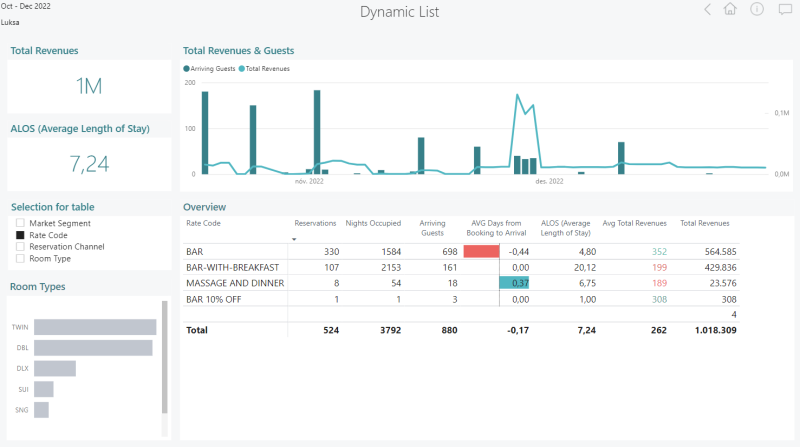
- Dynamic List
- Booking Details
Revenues page in Hotel report was updated and has the option to switch between revenues with VAT or without VAT. A new page called Revenues (Items) was added that shows breakdown of revenues by item hierarchy.
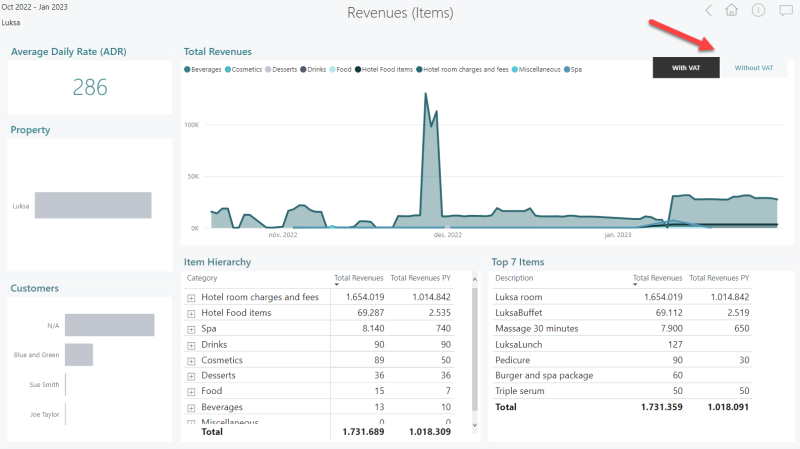
Total Revenues now includes revenues which are not included in rate, f. ex. buffet. Items which are paid on delivery (f. ex. if buffet is paid with cash at a restaurant) can be viewed under Other Revenues in the page Revenues Analysis.
Staying report page shows daily breakdown of how many guest are arriving, guest staying, and departing guests. Guest staying also shows arriving guests, see image below: on October 19 there are 180 arriving guests and the same number of staying guests. The page also shows this for rooms.
Dynamic List page shows key measures for Rate Code, Market Segment, Reservation Channel, and Room Type. You can switch between those using the options in Selection for table.
Booking details shows a table with reservation number, guest name, guest type, reservation channel, market segment, arrival date, departure date, nights occupied, and room number.
Dataset Items
We have added a Bus Matrix report page (2) to the Dataset Items report that displays the bus matrix for all fact tables, that is which fact tables are connected to which dimensions. You can filter the bus matrix by reports to see which fact tables are used in each of the report templates.
All new measures and fields for new fact tables have been added to Dataset Items.
Bug fixes
Data warehouse
Fixed duplicate line error in dItem insert/update when staging table is incrementally loaded.
Fixed an issue with unposted purchase orders being connected to SK_Item in fPurchaseOrders.
Fixed Purchase Order - status column is not showing correct status of the order.
Fixed duplicate lines in transfer order, transfer order receipt and transfer order shipment.
- This was solved by adding document number in the join with the Transfer Header table in Transfer order shipment and receipt tables. In Transfer Order Receipts we also added ranking before the merge.
- Also adding ranking on key to Transfer order table.
- Changes were made to the following SPs:
- factTransferOrder
- factTransferOrderShipments
- factTransferOrderReceipts
Fixed no data in Account period causing issues in Date table in reports. Added COALESCE for [FiscalYearStart] column. If there is no [Starting Date] in account period, we set the value to 1 by default.
Reports
Updating measure for report page Top 10 in sales report, for members, customers, countries, and stores. Reason for this was that in some cases this was not showing top 10, therefore updated the measure to fix that issue.