In this article
The calculation of Average Daily Sales uses the historical sales data which are defined in the Sales Profile for the item. The result of this calculation is the historical average sales which will be used as forecast for future sales.
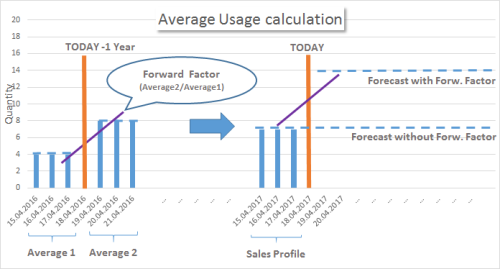
The Forward Sales Profile can improve this calculation by considering sales patterns in previous periods. The Forward Sales Profile lets you to define a comparison period. For this comparison period, the system calculates the average sales before the comparison date and the average sales after the comparison date. The time horizons for the periods before and after the comparison date can be set up. The resulting two averages are compared and the Forward Factor is calculated from those values.
The Forward Factor describes a change (increase/decrease) in the sales pattern in the comparison date. The reason for this change could be a seasonal selling pattern or a trend.
Finally, the Forward Factor is applied to today's forecast - assuming that the seasonal pattern will appear again in the current period.
This feature attempts to forecast the future sales of an item for a given period, based on historical sales patterns from the previous year and then uses this number to suggest a forecast Average Daily Sale value based on this year’s sales period.
For events, where the mapping cannot be done with a date formula (for example Easter), the Forward Sales Profile calculation is able to consider the Replenishment Calendar.
Today’s date is 18.04.2017.
In the Forward Sales Profile form, enter the code 3D3D, the back period Back Period Calc. Formula is set to 3D (three days). The Forward Period Calc. Formula is 3D (three days).
The first period defined is therefore from 18.04.2016 and going back to a date 3 days prior to this, to 15.04.2016. The average sales in that period is 4 pieces.
The second period is from 19.04.2016 and going forward to a date 3 days ahead of this date or to 21.04.2016. The average sales in that period is 8 pieces.
The replenishment process calculated the Average Daily Sales for the first (back) and second (forward) period. The increase between those two periods is calculated as a factor and is 8 / 4 = 2. In other words, the average sales doubled between those two periods.
The Forward Factor is then calculated as follows:
Factor = Average Daily Sales Forward Period / Average Daily Sales Back Period
The Forward Factor is finally applied to the forecast calculated using the Sales Profile. In the above example the original forecast would be 7 pieces per day. With the Forward Sales Factor the forecast demand will be adjusted to 14 (the original 7 pieces multiplied with the Forward Factor 2).
Restrict data to
The Average Daily Sales Forward Period and Average Daily Sales Back Period consider historical data in the comparison periods. The most precise way to calculate this would be on item level, but very often items do not exist anymore due to their lifetime.
The fields below Restrict Data to let you define the level of detail for the comparison. If you select the fields Location Code, Division, Item Category, Retail Product Group, but not Item No., the system will compare the sales in the comparison periods for the same Location and the Retail Product Group for the calculated item. The result will be a more general value which represents the sales pattern changes for the complete Retail Product Group.
See also