Open the Configuration Tool, and click the Debugging tab. There you will see a section that is for debugging each of these processes, any process that is activated will show up here, others will be hidden.
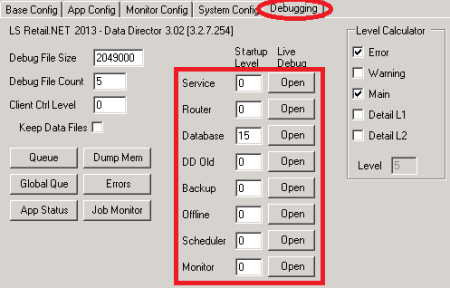
| Service | DDService.exe | Service program you see in Windows Services. It takes care of running all other DD Processes and keeping them alive. Also handles system updates and Configuration changes. |
| Router | DDRouter.exe | Handles all Job routing between DD Processes and DD Hosts. Incoming connections from DD3 and DD3 TransAutomClient.dll come in here. |
| Database | DDDatabase.exe DDDatabase86.exe |
Database processing. There are 2 separate versions of the DDDatabase processes. If CFront is selected in the App Config, tab, DDDatabase86 process is used to handle CFront database processing. DDDatabase handles all other request to other databases, like SQL and NAV 2013. |
| DD Old | DDIncoming.exe | Incoming connections from DD2 Services and DD2 TransAutomClient.dll. Job data is converted to and from DD3 data format. Incoming requests are sent to DDRouter. |
| Backup | DDArchive.exe | Monitor Collection process that takes Job data from the Archive folder and DDRouter memory and generates a DD Job to be inserted into Monitoring Database. |
| Offline | DDOffline.exe | Process that pulls a job from Pull host and/or looks for jobs in the Incoming pull path and sends the jobs to DDRouter for processing. |
| Scheduler | DDScheduler.exe | Scheduler service to run scheduler jobs in LS One Site Manager or LS Retail NAV. |
| Monitor | DDMonitor.exe | Monitor service that analyzes data for LS One Site Manager. |
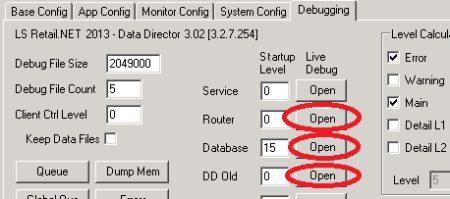
To check for an error when running a test connection or a job from LS Retail NAV, open Live Debug for Router, Database, and DD Old by clicking the Open button for each of these processes.
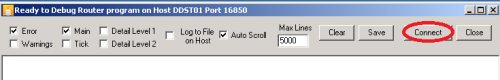
You will get 4 Debug windows, one for Router and DD Old and 2 for Database (if cfront is selected). You may get more windows open for Database if cfront is selected and the Data Thread Limit is set to more than 1, then you get windows for each CFront Database process.
Click Connect to connect all the debug windows. To begin with it is enough to have Error and Main selected, but more detailed debug data can be seen by selecting Detail Level 1 and 2.
A working Test connection using DD2 control would look like this:
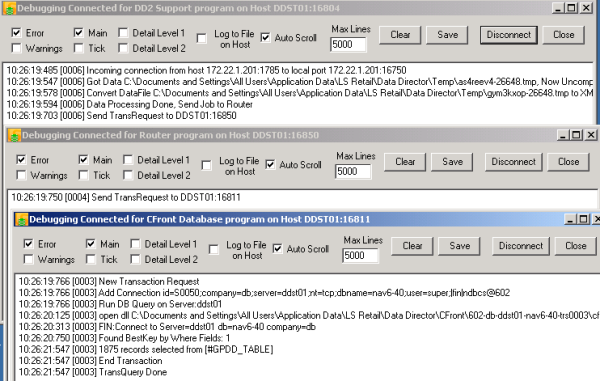
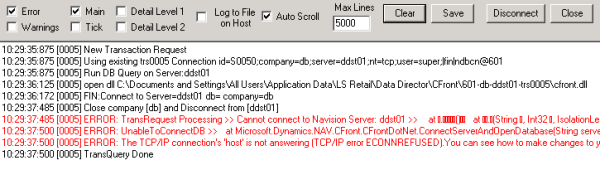
If there is an error, the error message will show up in red color. A database connection error would show up in the Debug for the Database process
To copy debug text from the window, you can copy one line by selecting the line, and the press Ctrl-C and the line data will be copied into the clipboard. Even if you do not see the whole line on the screen, the data for the whole line will be copied to clipboard. You can then paste this into a text editor, like Notepad, to see all of the data.
The data you see in the debug window is live stream and is not saved to any file. To tell the Process to log to a file, select Log to File on Host and a log file will be generated in the Data Folder under the Log Directory on the host you are debugging. You can close the live debug stream after you have chosen to log to file, the debug logging to file will continue after you close the window.
To save the debug stream that you have in the debug window to a file on local host, click the Save button.