In this article
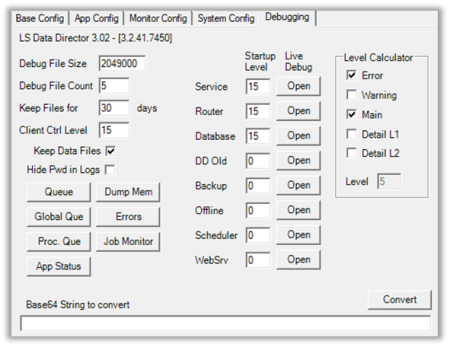
Here you can look at the Debug stream from each DD Process and look at the Job Queue in the Router. If you run into a problem, this is the place to check what is going on. Local DD versions and build numbers are also displayed here.
Note: If you need to contact LS Retail because of problems, you may be required to send the debug files and other information that you can get from the Debugging tab.
| Field | Description |
|---|---|
| Queue | Show Processing Queues within the Router. To update the status, click the Queue button again. |
| Global Queue | Show a list of all of the Jobs in Router memory. This is both jobs in or waiting for processing and jobs that are Done within the time frame set in the Job Memory Timeout value. To update the list, click the button again. |
| Dump Mem | Dump Router memory queue data to XML file for debugging. |
| Errors | Shows the latest errors detected by the system. The number of errors shown here is based on the Errors in Memory value. |
| Proc. Que | Process Queue that shows if any jobs are currently in processing and waiting for reply on any of the CFront Database Processes. |
| App Status | Shows the Running status of all DD Processes. |
| Job Monitor | Starts up a Job Monitor for the selected host. |
| Debug File Size | Maximum size of each Debug file. When a Debug file reaches this size, a new file will be created. |
| Debug File Count | Maximum number of debug files to create. When the limit is reached, the DD will override the first Debug file. |
| Keep Files for | Maximum number of days that older debugging files from previous runs will be kept in the Log folder. |
| Client Ctrl Level | File Debug level for Client Control Debugging to generate debug log from the client DLLs. Note: Client using the files has to be restarted for logging to start. |
| Keep Data Files | Keep Job Data files after processing. Useful to look at data files after data has been replicated, but is not correct. Note: This will require lot of hard disk space to hold all the job files. |
| Hide Pwd in Logs | Hides password from Database connection string in Debug Log files and Debug Live stream. |
| Startup Levels | File Debug level for each DD Process. This is used when the DD starts and if its value is greater than 0, the DD will log the data onto file. |
| Base64 Convert | Translate Base64 Text String to readable text. |
In order to find out which debug level value you should put in the Startup Level and Client Level fields, you can use the Level Calculator to calculate the value for you. Check the levels you want to log and then you can double-click the Startup Level field and it will fill in the correct value for you.
If you look at the XML Data files from the work folder, you may see that the text strings look as if they only contain garbage text. You can copy this text, paste it into the Base64 String field, and click Convert to see what it actually means.
Queue
The Router has a few Queues where it stores all jobs waiting to be processed. Here you can see the status of these queues and if any jobs are waiting there to be processed.
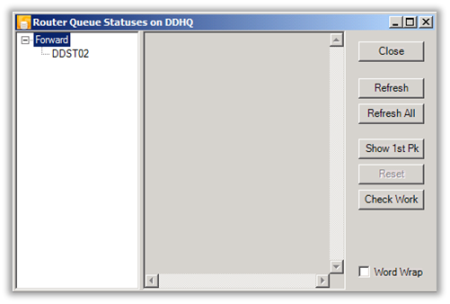
If no job is waiting, you see a list of available queues and no data within the queue.
If a job is waiting in the queue, you will see Host sub queues within the processing queue, and then job sub queues within the Host queue.
- Click either the Host queue or Job queue to see how many packages or jobs are waiting and the overall status of the queue.
| Description | |
|---|---|
| RegTime | Last time pack was accessed in the queue. |
| Offline | If Host is an offline host, the job will wait until that host connects and collects the jobs waiting to be forwarded to that host. |
| Error | If there is any error and error message associated with the queue. |
| Waiting | If the job is doing Database access or being forwarded to the next host, the router waits for a status update on the job process. If the queue gets stuck in processing mode with waiting as true, you can reset the queue by clicking the Reset button. |
| On Hold | The queue has been put on hold and will not be processed until taken off hold. |
| Data Cnt | Number of Jobs waiting in the queue. |
Tip: Select the check box Word Wrap to wrap the information text, if a long error message is present.
The Refresh button refreshes one queue node and Refresh All refreshes all queues.
The Show 1st PK button pulls data from the first job data pack in queue and displays information about the job and the host.
You can use the Check Work button to reload any ghost jobs that are waiting in the Work folder but which have for some reason been lost from the Queue or Job Monitor. Note: This should only be used when there are no jobs waiting in Job Monitor and DD is idle as it may override some statues of jobs that are currently in processing.
App Status
Behind the scenes, the DD consists of a few processes that each has a special purpose. To look at the status of each process and see if they are all running or not, check the dialog window below:
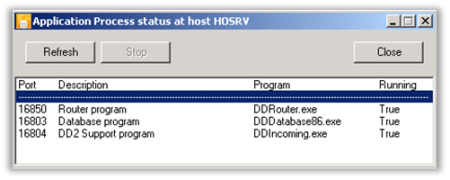
From here, you can shut down each process and start it again. This may be useful if one process is stuck or has a problem, or if a new update is available for that process, you can shut down one process without interfering with other processes and do the update.
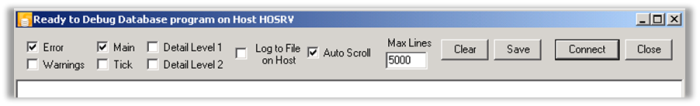
Process live debugging
To get a live debugging stream from a process running within DD, click the Open button for the process you want to debug. There are a few processes running behind one DD Setup and you can debug every one of them. To be able to connect, you need to have direct access to the host where the DD is running and also be a valid user, because this connection uses only TCPS mode and does go directly to the process socket port, not via general incoming Data port.
Data Director processes are:
| Process | Description |
|---|---|
| Service | Main DD Service application. This is what you have in Windows services and it takes care of keeping other processes alive. |
| Router | The heart of the Data Director. Takes care of routing jobs to correct DD processes and other DD hosts. |
| Database | Handles all Database communications. |
| DD Old | Support for communication with older DD. Converts the old DD2 protocol to the new DD3 protocol and handles all incoming and outgoing data transfer from and to old DD2. |
| Scheduler | Scheduler Service that process Jobs to be sent to DD. |
| Offline | Pulls main DD Host for new jobs and monitors incoming folder for manual transfer jobs. |
| Backup | Monitor Collection Service that generates jobs with DD Job Data. |
| WebSrv | Handles LS Central WS communications. |
| Field | Description |
|---|---|
| Log to File on Host | This will activate File Debugging on the host where DD is running. If the check box is left selected after you disconnect from the DD Process, debugging will continue logging into the file. |
| Max Lines | Maximum number of debug lines that Live debugging will show. |
| Clear | Clear Debug stream window. |
| Save | Save data in Debug stream window to file on local host. You can also select debug lines from the Debug stream window and press Ctrl+C to copy them to the clipboard so you can pass them into other applications, such as email or notepad. |
| Connect | Connect to DD Process and start Debugging. |
Debug levels
| Description | |
|---|---|
| Error | Logs all Error Messages. |
| Warning | Logs Warning Messages, these are errors that are not something that will affect the health of the system. |
| Main | Logs Main Activity Messages, useful to see what they system is doing. |
| Tick | Heart beat check. Note: This generates extreme amount of data and should only be used to check if application is locked up or actually doing something. Never use this for file debug level. |
| Detail Level 1 | Logs Activity Messages in more detail, useful to look at to see what the system is doing and provides more detailed information than Main level does. |
| Detail Level 2 | Logs Activity Messages in even more detail. |
Note: When debugging Database process and you have CFront mode activated under App Config, you will get 2 or more windows when you click the Debug Database button.
The first 2 windows will have port 16803 and 16811 (depends on what the base port is set to, default is 16800).
- 16803 processes is for general database processing for all other databases than the one using CFront.
- 16811 is for CFront processing and if Data Thread Limit is set to a higher value than 1, you will get more windows counting up from 16811. Each of those is for CFront processing and when DD sends a job to processing, it will send the job round robin between these processes, unless one of them is already busy. If they are all busy, DD starts sending to all again.