About This Release
Released - January 30 2026
In this version of Analytics for LS Central the focus has been on the new Hospitality Analytics report and additions of Budget and Section and shelf report pages to the Sales Analytics report. The new Hospitality report includes sales and inventory reports. These reports are aimed especially at quick service, fine dining, and KOT information from KDS (Kitchen Display Service). The Hospitality report includes three dashboards and over 30 overview and detail report pages.
This version of Analytics supports versions 8.4 and later of LS Central On-premises and later versions of LS Central SaaS. Setup of Analytics for LS Central SaaS needs some additional setup from the standard Analytics onboarding process which is explained in detail in the onboarding documentation.
Note: Updates for version 2023.4 is provided in a special update package. If you have already set up version 2023.4, you can update to 2024.1 without creating a new instance of Analytics. See update guidelines for more information.
Note: If you have customizations in your Analytics instance, you need to make sure before you start that the updates do not affect these customizations.
The following is a list of changes and key features in Analytics version 2024.1.
New or Enhanced Features
Setup
Product package
Prestaging table creation scripts
Prestaging scripts have been added to for the following LS Central tables:
- LSC Retail Sales Budget Entry
- LSC Retail Sales Budget Name
- LSC Section Shelf
- LSC Store Section
- LSC Hospitality Service Flow
- LSC Dining Table Type
- LSC Dining Table Property
- LSC Offer Line
- LSC Deal Modifier Item
- LSC POS Menu Line
- LSC POS VAT Code
- LSC Dining Table History Entry
- LSC Time Schedule Line
- LSC Dining Table Receipt Entry
- LSC Din Tbl Hist Entry Res Arc
- LSC KDS Modified Status
- LSC KDS Display Station
Scheduler job header file
The Scheduler header file has been updated to include subjobs for the new prestaging tables:
- LSC Retail Sales Budget Entry
- LSC Retail Sales Budget Name
- LSC Section Shelf
- LSC Store Section
- LSC Hospitality Service Flow
- LSC Dining Table Type
- LSC Dining Table Property
- LSC Offer Line
- LSC Deal Modifier Item
- LSC POS Menu Line
- LSC POS VAT Code
- LSC Dining Table History Entry
- LSC Time Schedule Line
- LSC Dining Table Receipt Entry
- LSC Din Tbl Hist Entry Res Arc
- LSC KDS Modified Status
- LSC KDS Display Station
Deployment
Support for additional special characters in password was added to policy in deployment script.
Documentation
The Prerequisite page has been moved in the menu so it is now visible above the Onboarding sections.
Section on Analytics for LS Central licenses has been added to the Prerequisite page.
Azure Data Factory
Pipelines
Four new pipelines were added to the standard fact pipelines module in Bicep:
- PL-SP-factRetailSalesBudget
- PL-SP-factDiningAreaPlanStatistics
- PL-SP-factDiningReservation
- PL-SP-factKOTLines
Data Warehouse
Database
Tables
Six new dimension tables were added:
- dSalesBudget
- dSectionShelf
- dDealItem
- dDiningTable
- dHospitalityType
- dTimePeriod
Four new fact tables were added using the listed staging tables:
- fRetailSalesBudget
-
fDiningReservation
- For this table to be populated correctly, you need to run the Calculate Dining Area Statistics report regularly to add the reservations to the history entry table. The table will only contain closed reservations.
- fDiningAreaPlanStatistics
- fKOTLines
- In this table we combine information from KOT line routing table with KOT line header and line information. The KOT line Actual Time column shows for each prep station the minutes that passed from the KOT creation until the item was bumped from a station. For expeditor stations it is the time from when the last item was bumped from the prep station until the KOT is bumped from expeditor station. (Example) Items that are routed directly to expeditor station get the full time from creation to expeditor station bump as the KOT line Actual Time.The KOT Actual Time column shows the complete time for this KOT from KOT creation until it is bumped from expeditor station. The same applies for all lines with the same KOT number.
The following columns were added to FactSalesPosted table:
- VATDescription
- SK_SectionShelf
- SK_DealItem
- SK_DiningTable
- SK_HospitalityType
Stored procedures
dimMergedItem stored procedures were updated to add rows for all combinations of Division, Division and Category, and Division, Category and Product group to the dItem table. This is to make it easier to filter on these item variables in the budget report.
Nine new stored procedures were added for loading of data to the new dimension tables:
- dimMergedBudgetExec- Control procedure that runs either:
- v21dimMergedBudget - does not include default budget column for Budget dimension
- v22dimMergedBudget - includes default budget column for Budget dimension
- dimMergedSectionShelf - loads Section/Shelf dimension
- dimMergedDealItem - loads Deal item dimension
- dimMergedDiningTable - loads Dining table dimension
- dimMergedTimePeriod - loads Periods used in Hospitality locations
- dimMergedKitchenDisplayStation - loads KDS station dimension
- dimMergedHospitalityType - loads Hospitality type dimension
factSalesPosted stored procedure was updated to add SK_SectionShelf value from SectionShelf dimension to the transaction lines.
Five new stored procedures were added for loading of data to the new fact tables:
- factRetailSalesBudgetExec - checks if Retail Product group table exists and if it does executes factRetailSalesBudget
- factRetailSalesBudget - loads retail sales budget fact table
- factDiningAreaPlanStatistics - loads dining table statistics
- factDiningReservation - loads reservation history
- factKOTLines - loads KOT line history
The staging tables used in the stored procedures listed above have been added to the LSInsight$SourceTablesMap table in the data warehouse.
Reports
Sales Analytics
Sales Overview
We have introduced new measures in the Sales Overview report, LY Net Sales (Last year same period). Now the sales overview visual shows the Net sales for each month in the last year compared to the same month the year before.
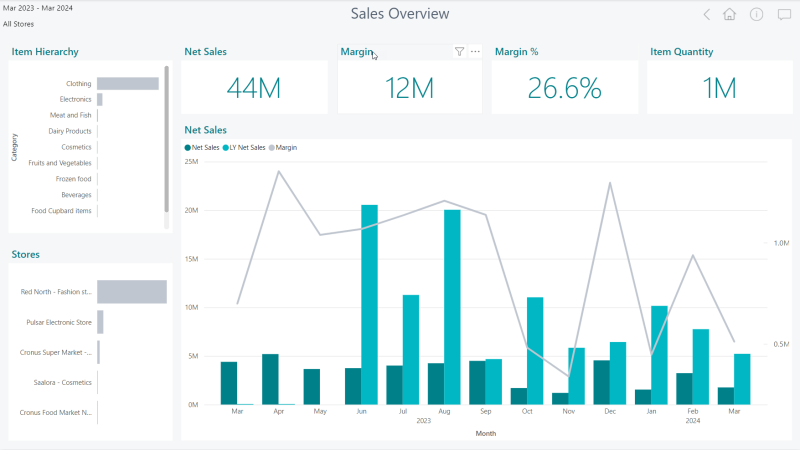
We have also added LY Margin to the Sales Analytics for use in other report pages.
Sales Budget
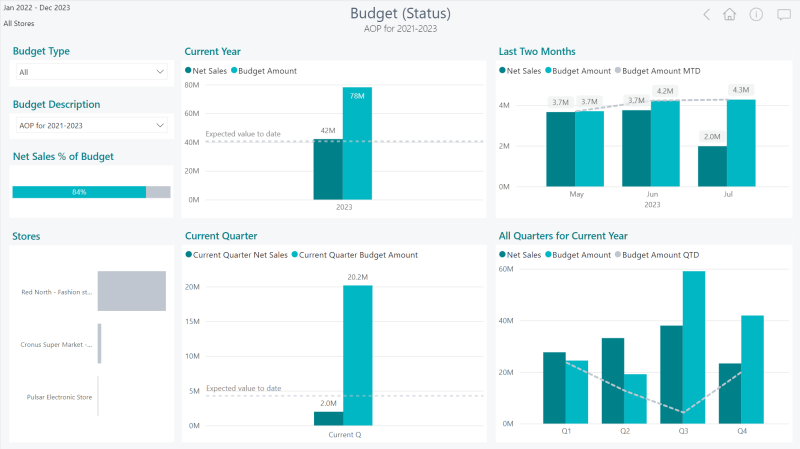
A new section of three report pages has been added to the Sales Analytics report, called Budget.
Now you can see all your budget information compared with your sales data. In the page called Budget Status, you can quickly see how you are doing.
-
The first visual shows Net Sales for this year compared to the budget amount. The grey line shows the expected net sales value from beginning of year until today according to the budget. So you can see whether your "to date" net sales are under or over the budget. In the image below you can see that sales are on target compared to the budget amount.
-
The third visual shows the same information as the first, but for the current quarter. In the image below you can see that "to date" net sales in the current quarter are not on track compared to the budget amount.
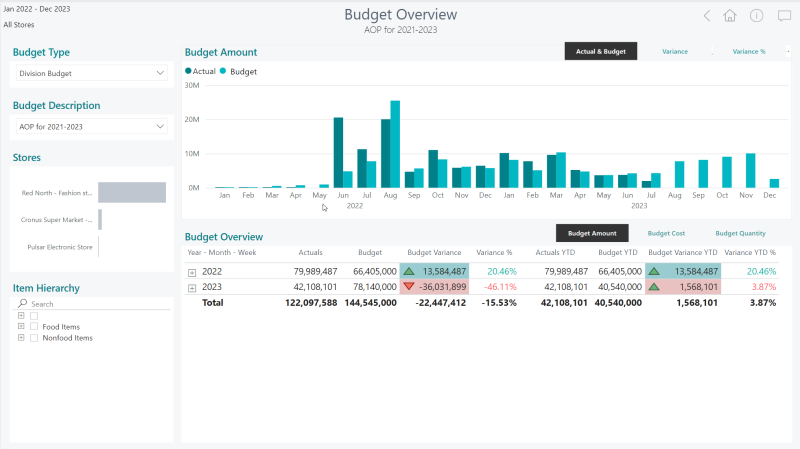
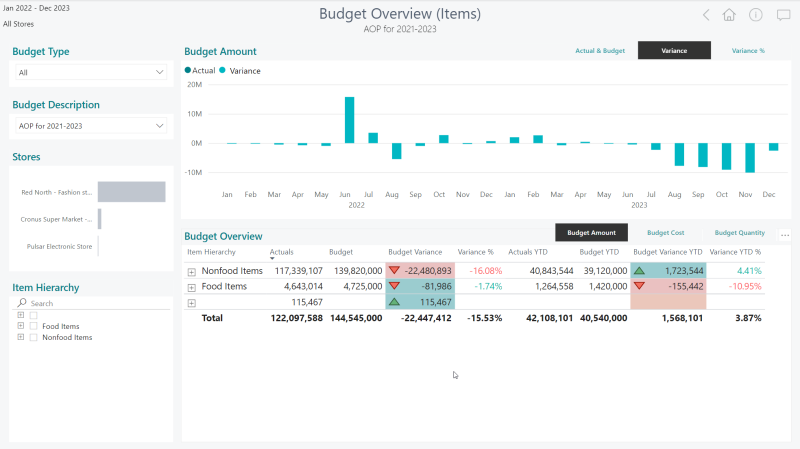
There are also two other pages for budget information: here you can see a month comparison in graph for actual and budget, variance, and variance in %. In the table below the graph you can see actual and budget by date, in other page called Budget Overview (Items) are the same but with item hierarchy. That is good to see what is causing the variance (food items is below budget and non food items are above for example).
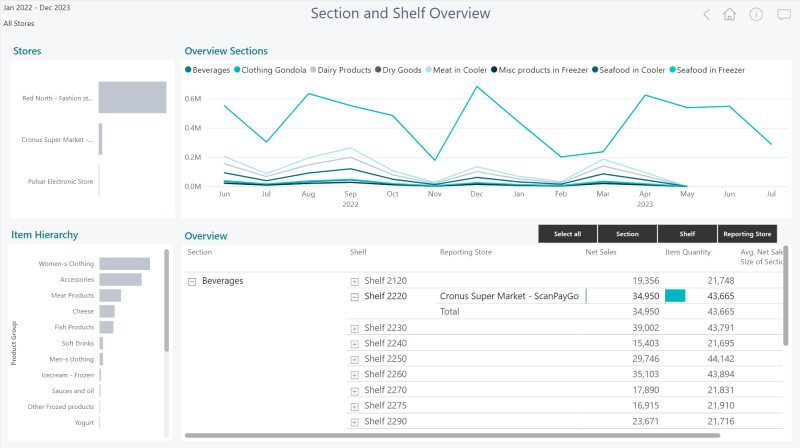
Section and Shelf Overview
A new page has been added in the Sales Analytics report called Section and Shelf Overview, it shows Net sales and sales quantity by section and shelf location in the store.
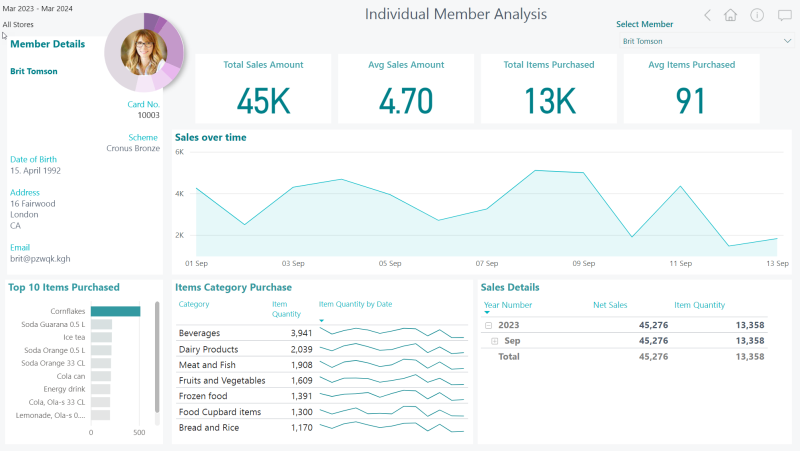
Individual member report
A new page displaying individual member analysis has been added to the sales report.
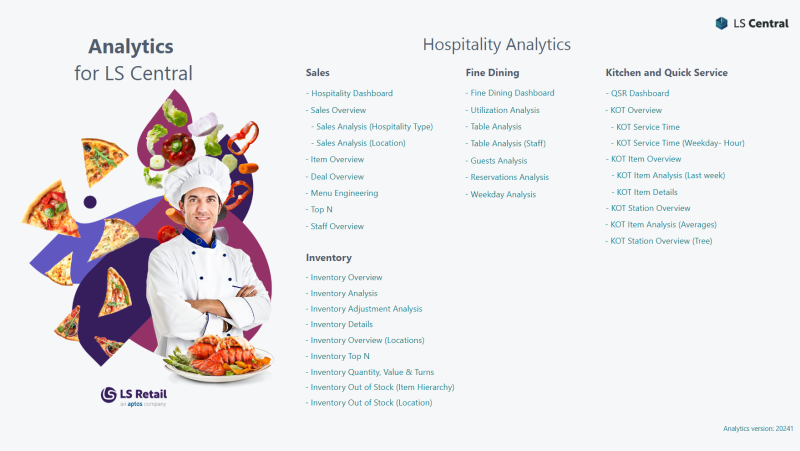
Hospitality report
The new Hospitality Analytics shows KPIs and visuals for data created with the Hospitality functionality. These are for example Sale by hospitality type, menu engineering report, dining table and section utilization statistics, guest statistics, reservation analysis, and Kitchen Order Ticket (KOT) statistics, such as service times by orders, display stations and items. The report is structured like our other reports and begins with a navigation page where you can see the different report page sections.
Sales
The Sales section starts with the Hospitality dashboard where a manager can see total analytics and KPIs for all restaurants.
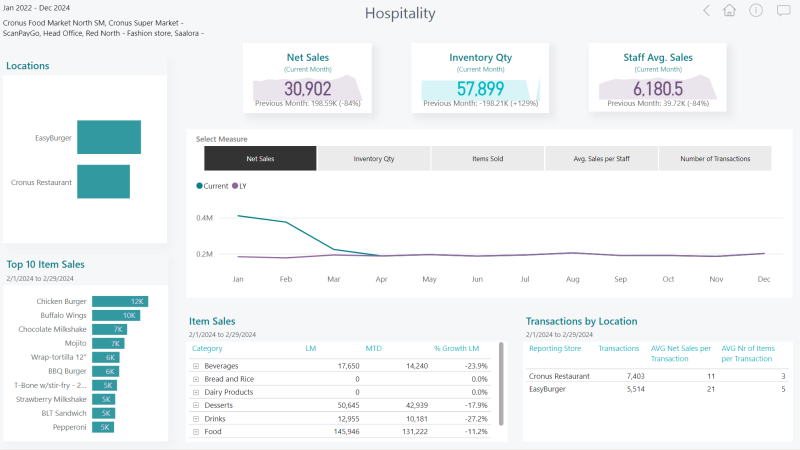
The sales section also includes more classic sales reports, but now you can slice by hospitality type. We have also included new sales reports for deals and deal modifiers and for menu engineering.
Fine Dining
The Fine Dining dashboard is meant for restaurant managers of fine dining restaurants. It shows an overview of different KPIs for the current month and last week. For example, Number of reservations, Average time spent on table by table, and seating efficiency.
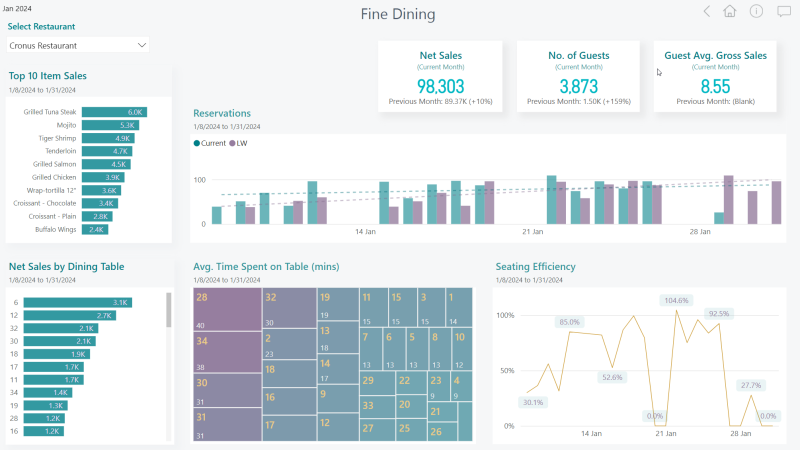
In this report we decided not to report on open reservations, and therefore you need to run the Calculate Dining Area statistics calculation regularly in LS Central to move the reservation data to the history table that is used as the source for the data warehouse.
Kitchen and Quick Service
The Quick Service Restaurant dashboard is meant for managers of quick service restaurants. Here you can see sales and order KPIs for the current month and the number of KOT orders, average KOT service time, and KOT orders per hour by weekday for the last week.
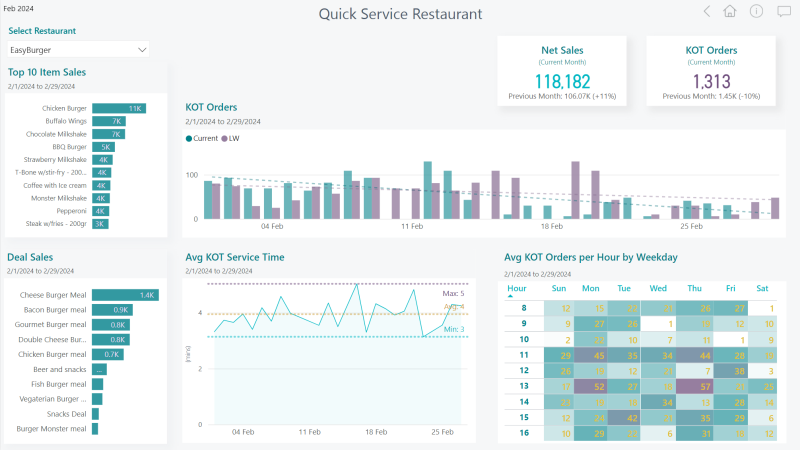
You need to make sure that the KOT data is located in the LS Central database used as source for Analytics to be able to report on KOT data. This should be the case when you are running LS Central in SaaS, but can be more tricky when LS Central is on-premises and the KOT data is not stored centrally.
The other report pages include extensive analysis of the number of KOT orders, KOT items, and service time.
Inventory
The inventory section includes a selection of reports from our inventory report suite that we found especially suited to Hospitality. This includes an adjustment report that can be used to follow ingredient waste adjustments.
Calculation groups
In this new report we introduced calculation groups for our time intelligence measures, such as LM, LW, LQ, LY MOM, YOY, MTD, QTD, YTD and many more.
Calculation groups are a powerful tool to decrease the number of measure and work with any value measure.
Calculation groups are still in preview, so to be able to open the model explorer you need to enable the preview feature in PBI desktop. How to do that and for detailed information about how to implement and use calculation groups, see this article on the Fabric community.
You can also read more about calculation groups and how to manage them in the Microsoft documentation.
Bug fixes
Data warehouse
Changed lines FactSalesPosted with SIL datasource to use Quantity (Base) instead of Quantity. Purchase and transfer order tables include both quantity and quantity base columns as well as unit of measure so no changes were needed there.
We have reversed signs for Credit memo line amounts and quantity where needed, since they were not being subtracted from sales amounts and quantities but were added to them. The columns that are reversed are [NetSalesAmountLCY], [VATAmount], [GrossSalesAmountLCY], [DiscountAmountLCY].
CustomerNoName is a combination of the No_ and Name columns in the staging tables. Since the No_ field is varchar(20) and the Name field is varchar(100), we increased the size of the combined field to varchar (200).
Reports
Sales report - added measures for same period last year - LY Net Sales and LY Margin.