In this article
Actual Discount Performance Chart
Planned Discount Performance Chart
The Discount Performance Charts provide a comprehensive analysis of an item's promotional sales, encompassing both past performance and future forecasts. This includes the Actual Discount Performance Chart, which reviews historical results, and the Planned Discount Performance Chart, which projects upcoming demand.
Actual Discount Performance Chart
The Actual Discount Performance Chart provides a graphical comparison of an item's sales patterns and quantities during both discount and non-discount periods. It also visualizes the impact of out-of-stock situations on sales in these periods. You can apply filters for stores and variants; if no filters are set, the chart displays aggregated values for the item.
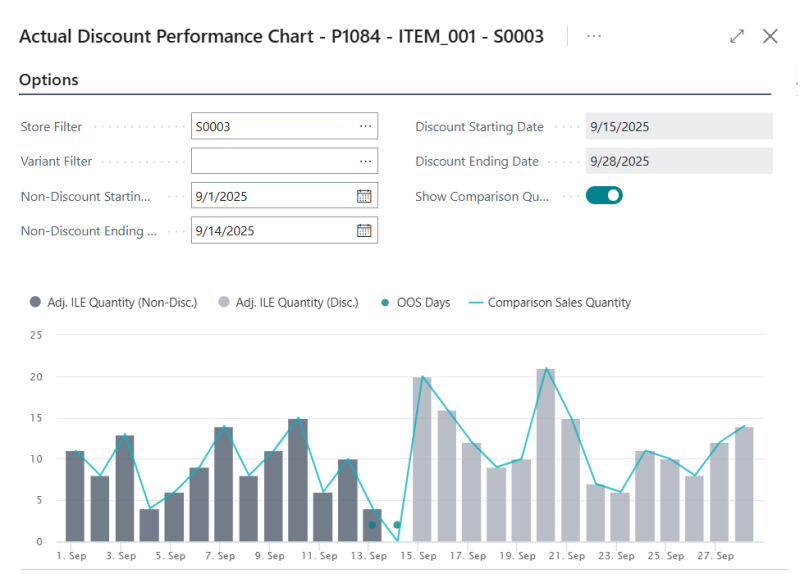
The chart below shows the sales pattern for item ITEM_001 over the non-discount and discount periods. The non-discount and discount periods each spans 2 weeks across September.
- The dark gray bars represent the sales during the non-discount period in the first half of September.
- The light gray bars represent the sales during the discount period in the second half of September, which had higher sales than the non-discount period overall.
- The dotted marker points on 13th and 14th September indicate that the drop of sales could be related to an out-of-stock situation and not to a change in demand.
- The blue line shows all actual sales for the item on each day, regardless of the promotional status.
The Actual Discount Performance Chart for a specific item, variant, and store is accessible from the Actual Discount Performance page of the respective Periodic Discount pages:
- Click the
 icon, enter Discount Offer List, Multibuy Discount List, or Mix&Match Offer List, and select the relevant link.
 - Select an existing Periodic Discount.
- Click Discount Performance - Actual Performance - Show Actual Discount Performance.
- Select an existing record on the Actual Discount Performance page.
- Click Show Discount Performance Chart to open the Actual Discount Performance Chart page for the specific item, variant, and store of the record.
This chart gives you information about:
- Adj. ILE Quantity (Non-Disc.): A graph of the total SHA Quantity and ILE Sales Quantity on each non-discount day.
- Adj. ILE Quantity (Disc.): A graph of the total SHA Quantity and ILE Sales Quantity on each discount day, corresponding to the current Periodic Discount.
- Comparison Sales Quantity: A graph of the total SHA Quantity and ILE Sales Quantity on each day, regardless of the promotional status. To view this information, select the Show Comparison Quantity check box on the Options FastTab.
- OOS Days: Over the specified period, the days when the item was out of stock, are highlighted as OOS Days, represented by dotted marker points.
Note: If you drill down from the graph lines for Adj. ILE Quantity (Non-Disc.), Adj. ILE Quantity (Disc.) or the Comparison Sales Quantity, the system opens the Sales History Adjustment page. There, you can make any required adjustments to the sales history for the item on the fly. You can see the result immediately reflected on the chart for the respective date and, if applicable, store or variant.
Note: If you drill down from the dotted marker points for OOS Days, the system opens the Replen. Out of Stock Days page, where you can view the Replen. Out of Stock Logs for the item on the respective date and, if applicable, store or variant.
The Actual Discount Performance Chart lets you choose the graphs you want to view, and filter the data to suit your needs using the following fields on the Options FastTab:
| Field | Description |
|---|---|
| Store Filter | This field specifies the store to filter the chart data on. When blank, the chart shows the values for all stores where the discount is applicable. |
| Variant Filter | This field specifies the variant to filter the chart data on. When blank, the chart shows the values for all variants where the discount is applicable. |
| Non-Discount Starting Date | This field specifies the starting date for the non-discount period. |
| Non-Discount Ending Date | This field specifies the ending date for the non-discount period. |
| Discount Starting Date | This field shows the starting date for the discount period. |
| Discount Ending Date | This field shows the ending date for the discount period. |
| Show Comparison Quantity | This field specifies whether to show the comparison sales quantity in the chart. |
When accessed directly from the Periodic Discount pages, the Actual Discount Performance Chart shows the sales trend and aggregated sales quantity for all the items relevant to the Periodic Discount:
- Click the icon, enter Discount Offer List, Multibuy Discount List, or Mix&Match Offer List, and select the relevant link.
- Select an existing Periodic Discount.
- Click Discount Performance - Actual Performance - Show Actual Discount Performance Chart to open the Actual Discount Performance Chart page for all items.
Note: The Variant Filter and the OOS Days measure are not available in the aggregated chart for all items.
Planned Discount Performance Chart
The Planned Discount Performance Chart graphically represents the forecasted demand for an item during an upcoming discount period. This forecast is generated by calculating a weighted average of historical sales from one or more linked historical discounts.
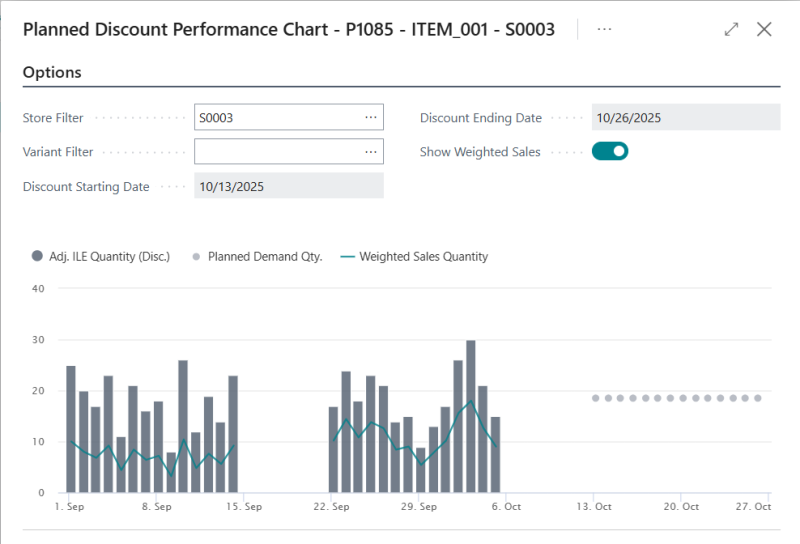
The chart below shows the sales pattern for item ITEM_001 across three discount periods: two historical discounts and the current discount.
- The first series of dark gray bars represents the sales during the discount period from the first linked historical discount.
- The second series of dark gray bars represents the sales during the discount period from the second linked historical discount.
- The blue line represents the weighted sales across the two historical discounts periods. In this example, a 40% weight is applied to the first historical discount and a 60% weight is applied to the second historical discount.
- The dotted marker points represent the expected daily sales of the respective item and, if applicable, store or variant, for the new discount period from 13th to 26th October. This forecast is based on the planned discount performance records, which are calculated using the weighted sales from the linked historical discounts.
The Planned Discount Performance Chart for a specific item, variant, and store is accessible from the Planned Discount Performance page of the respective Periodic Discount pages:
- Click the icon, enter Discount Offer List, Multibuy Discount List, or Mix&Match Offer List, and select the relevant link.
- Select an existing Periodic Discount.
- Click Discount Performance - Planned Performance - Show Planned Discount Performance.
- Select an existing record on the Planned Discount Performance page.
- Click Show Discount Performance Chart to open the Planned Discount Performance Chart page for the specific item, variant, and store of the record.
This chart gives you information about:
- Adj. ILE Quantity (Disc.): A graph of the total SHA Quantity and ILE Sales Quantity on each discount day, corresponding to the relevant linked historical discounts.
- Weighted Sales Quantity: A graph of the total SHA Quantity and ILE Sales Quantity on each discount day multiplied with the Weight and Additional Lift Factor of the relevant linked historical discounts. To view this information, select the Show Weighted Sales check box on the Options FastTab.
- Planned Demand Quantity: Shows the Daily Sales (Disc.) or Daily Sales (Non-Disc.) from the Planned Discount Performance record, on each day within the Validation Period of the new discount, represented by dotted marker points.
Note: If you drill down from the graph lines for Adj. ILE Quantity (Disc.) or the Weighted Sales Quantity, the system opens the Sales History Adjustment page. There, you can make any required adjustments to the sales history for the item on the fly. You can see the result immediately reflected on the chart for the respective date and, if applicable, store or variant.
Note: If you drill down from the dotted marker points for Planned Demand Quantity, the system opens the Planned Discount Performance page, where you can view the Planned Discount Performance records for the item, store or variant.
The Planned Discount Performance Chart lets you choose the graphs you want to view, and filter the data to suit your needs using the following fields on the Options FastTab:
| Field | Description |
|---|---|
| Store Filter | This field specifies the store to filter the chart data on. When blank, the chart shows the values for all stores where the discount is applicable. |
| Variant Filter | This field specifies the variant to filter the chart data on. When blank, the chart shows the values for all variants where the discount is applicable. |
| Discount Starting Date | This field shows the starting date for the new discount period. |
| Discount Ending Date | This field shows the ending date for the new discount period. |
| Show Weighted Sales | This field specifies whether to show the weighted sales quantity in the chart. |
When accessed directly from the Periodic Discount pages, the Planned Discount Performance Chart shows the sales trend, aggregated sales quantity and the expected daily sales for all the items relevant to the Periodic Discount:
- Click the icon, enter Discount Offer List, Multibuy Discount List, or Mix&Match Offer List, and select the relevant link.
- Select an existing Periodic Discount.
- Click Discount Performance - Planned Performance - Show Planned Discount Performance Chart to open the Planned Discount Performance Chart page for all items.
Note: The Variant Filter measure is not available in the aggregated chart for all items.
See also
Forecast Planned Sales Demand from Historical Periodic Discounts