About This Release
Released - May 11th 2026
In this version of Analytics for LS Central, we take a major step forward in delivering smarter, finance ready, and more user friendly analytics. This release strengthens the foundation of trust and accuracy with improved inventory valuation aligned with professional finance standards - Inventory Analytics new Stock Value and Cost calculation method, introduces powerful new reporting for sales budget and cost analysis - Sales Analytics, and provides administrators with a single, centralized setup experience to control analytics scope, performance, and cost - Analytics Setup Page.
At the same time, Analytics is expanding beyond traditional reporting with the introduction of AI powered data agents - New: AI-powered Data Agents for Analytics for LS Central, enabling customers and partners to explore their data using plain language questions, while still relying on the same validated data models behind the official Power BI reports. Together, these enhancements make Analytics for LS Central more accessible, more transparent, and better equipped to support confident, data‑driven decisions across the business
Explore the key features and updates in version 2026.2 using the links below:
New or Enhanced Features
Analytics Setup Page
The Analytics Setup in LS Central, introduced in LS Central v28.0, serves as the central control hub for configuring Analytics for LS Central, allowing administrators to turn Analytics on or off globally, enable or disable specific analytics modules (such as Finance, Inventory, Supply Chain, Hospitality, Hotels, and Bookings), manage which companies participate in analytics processing, and perform administrative actions like a full factory reset.
From this page, users can also configure task retention, monitor analytics operations through Analytics Tasks, and optimize performance and cost by automatically switching Azure SQL service tiers between calculation and normal operation periods. Overall, the page provides a single, unified entry point to control analytics features, scope, performance, and lifecycle management across the entire LS Central environment.
Inventory Analytics new Stock Value and Cost calculation method
We have introduced an updated inventory stock value calculation to improve accuracy, transparency, and alignment with LS Central/Business Central finance logic. Please find further information at the Stock Value page. A new separate version of the inventory report has been added to the Analytics for LS Central product package named Inventory Analytics to accomodate this new calculation method and it is expected in future release that the "old" version of this report will be removed.
With this update, inventory quantities and inventory value are calculated separately, using the same principles as for Business Central. Inventory quantities are now derived from all recorded inventory movements, while inventory value is calculated from actual cost postings and cost adjustments, rather than derived or average costs applied to transactions. Cost adjustments are reflected as separate entries, ensuring that historical changes are traceable and not rewritten. To achieve this new Tables were added to the semantic model and it is planned that the "old" fInventory table will be removed in future releases.
To support stable and finance ready reporting, the solution now includes a monthly inventory valuation snapshot. This snapshot provides consistent period‑end values suitable for financial reporting, while still allowing detailed drill‑down into underlying movements and cost entries when analysis is required.
As a result of this improvement, some historical inventory values may differ slightly from previous reports, particularly in periods affected by cost adjustments. These differences are expected and reflect a more accurate and auditable valuation method. Inventory quantities should remain consistent.
This update ensures that inventory reporting follows professional finance standards, delivers more reliable numbers, and provides better traceability for reconciliation and analysis.
Documentation
New page for Analytics Setup in LS Central has been added.
6 Initial load using Analytics setup page page was added to the onboarding process using LS Central SaaS with bc2adls export and Analytics in Azure data epxort method.
Stock Value page has been updated with the description and explanation for the new Stock Value calculation methods.
Inventory Analytics page was updated with the new Inventory report based on the new calculation methods and respective tables.
Setup
Product package
Prestaging table creation scripts
No new prestaging scripts were added.
Azure Data Factory
Pipelines
Changes in pipelines (classic and bc2adls based)
One new pipeline was added to the 2 - Staging Tables folder
-
AnalyticsControlTableStaging
Three new pipelines were added to 3-Modules > Fact Tables folder in the Data Factory
-
Inventory factItemLedgerEntry
-
Inventory factValueEntry
-
Inventory factMonthlyInventoryValuation
Three new pipelines were added to 4 - ETL Flows folder
-
Initial load with Control Page Processing
-
Scheduled run with Control Page Processing
For these last pipelines please go to Analytics Setup in LS Central page for further information
Data Warehouse
Database
Tables
Tables were added to the data warehouse for the new inventory calculations.
Three new fact tables were added:
-
fItemLedgerEntry
-
fValueEntry
-
fMonthlyInventoryValuation
Stored procedures
Three new stored procedures were added for loading of data to the new fact tables and bridge table:
-
factItemLedgerEntry
-
factValueEntry
-
factMonthlyInventoryValuation
Reports
Report Updates
Inventory Analytics - NEW
A new report has been added to Analytics for LS Central product package. The Inventory Analytics- NEW this report is a copy of the previous inventory report but rebuilt on the basis of the new Stock Value calculation methods. In future releases, the "old" Inventory Analytics Power BI report based on fInventory table will be deprecated and removed from the product package.
Semantic Model updates
Tables were added and removed to implement the new inventory calculations. All measures were updated according to this new logic; Inventory quantity comes from item movements, and inventory value comes from actual cost postings and adjustments.
Three new fact tables were added:
-
fItemLedgerEntry
-
fValueEntry
-
fMonthlyInventoryValuation
One Table removed:
-
fInventory
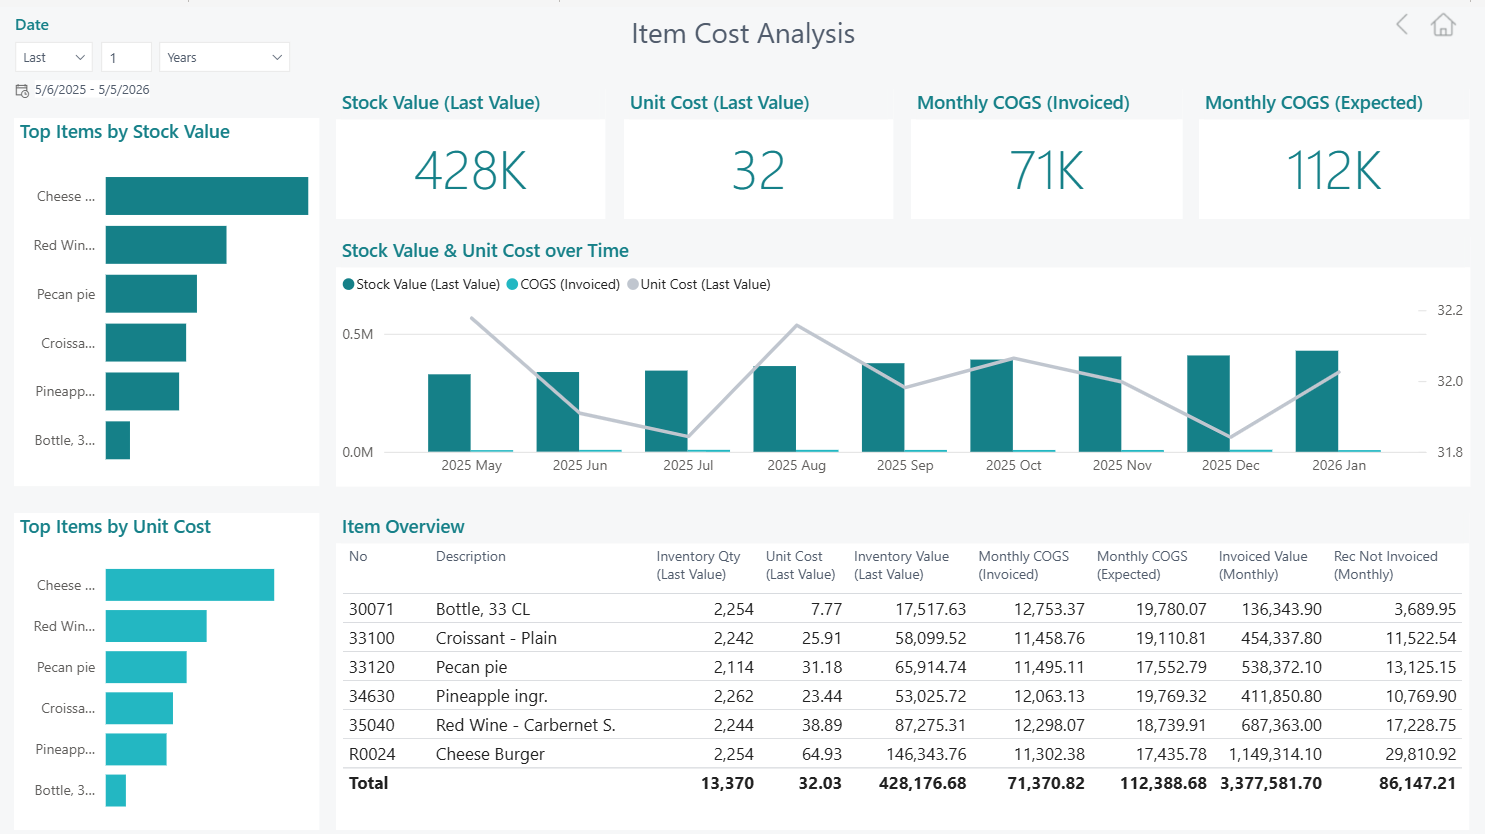
New Item Cost Analysis report page
This report page gives a high-level view of inventory cost performance by combining stock levels, unit costs, and cost of goods sold over time in a single analytical view. It helps users understand how inventory value and item costs evolve, which items have the greatest financial impact, and how operational activity translates into invoiced versus expected costs. By comparing trends over time and highlighting differences between what is expected and what has been invoiced, the report supports better cost control, cash flow monitoring, and identification of potential gaps in procurement or invoicing processes. Overall, it enables finance, supply chain, and operations teams to monitor inventory efficiency, spot risk areas early, and make more informed decisions around purchasing, pricing, and stock management.
Sales Analytics
Semantic Model updates
Two new dimension tables were added to accommodate the Budget Hiearchy featue available at LS Central:
-
Hierarchy Node
-
Hierarchy Node Links
One fact table removed:
-
fInventory
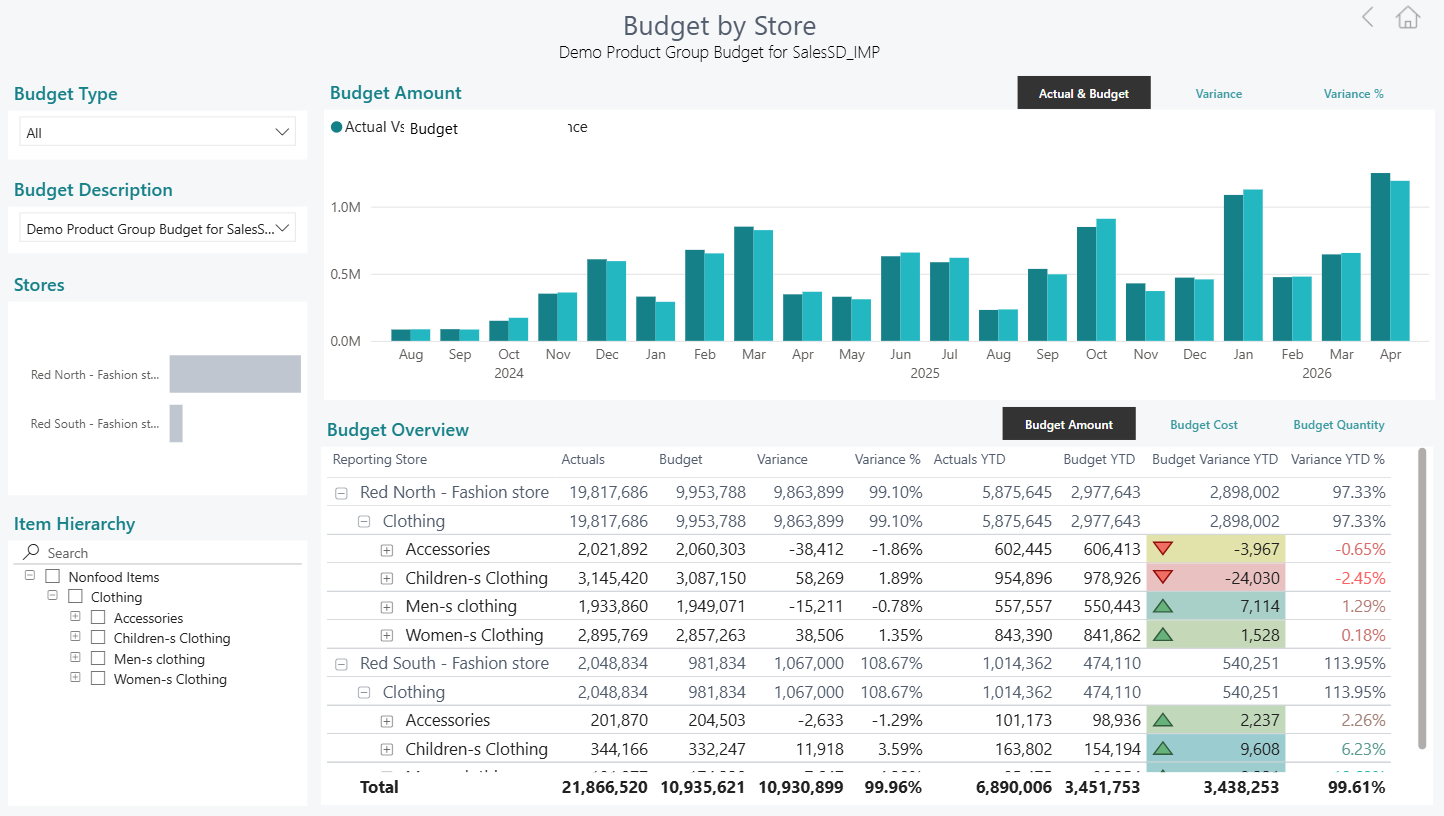
New Budget by Store report Page
The new Budget by Store page gives sales managers a single place to compare budgeted versus actual performance across stores, time, and product hierarchy. This is made possible by two new data tables introduced behind the scenes: a Hierarchy Node table that defines the full structure of product hierarchies (divisions, categories, product groups, and individual items), and a Hierarchy Node Links bridge table that connects each budget entry to exactly the right set of items it covers. Together, these tables allow the report to automatically resolve what a budget actually applies to, whether it was created at division, category, product group, or item level, and match it against actuals at the same grain.
Users can select any budget type and description from the slicers, then use the Item Hierarchy tree on the left to drill into any level of the product structure; the chart and the table instantly show the correct actuals, budget, variance, and YTD figures for that scope, with no risk of comparing a broad all-stores budget against a single store's sales or mixing different levels of aggregation.
Hospitality Analytics
Semantic Model updates
Tables were added and removed due to the new inventory calculations. All measures were updated according to this new logic; Inventory quantity comes from item movements, and inventory value comes from actual cost postings and adjustments.
Three new fact tables were added:
-
fItemLedgerEntry
-
fValueEntry
-
fMonthlyInventoryValuation
One Table removed:
-
fInventory
Supply Chain Analytics
Semantic Model updates
Tables were added and removed due to the new inventory calculations. All measures were updated according to this new logic; Inventory quantity comes from item movements, and inventory value comes from actual cost postings and adjustments.
Three new fact tables were added:
-
fItemLedgerEntry
-
fValueEntry
-
fMonthlyInventoryValuation
One Table removed:
-
fInventory
Note: All report pages underlying procedures, tables, columns and measures are subsequently reflected at the updated Data Catalog.
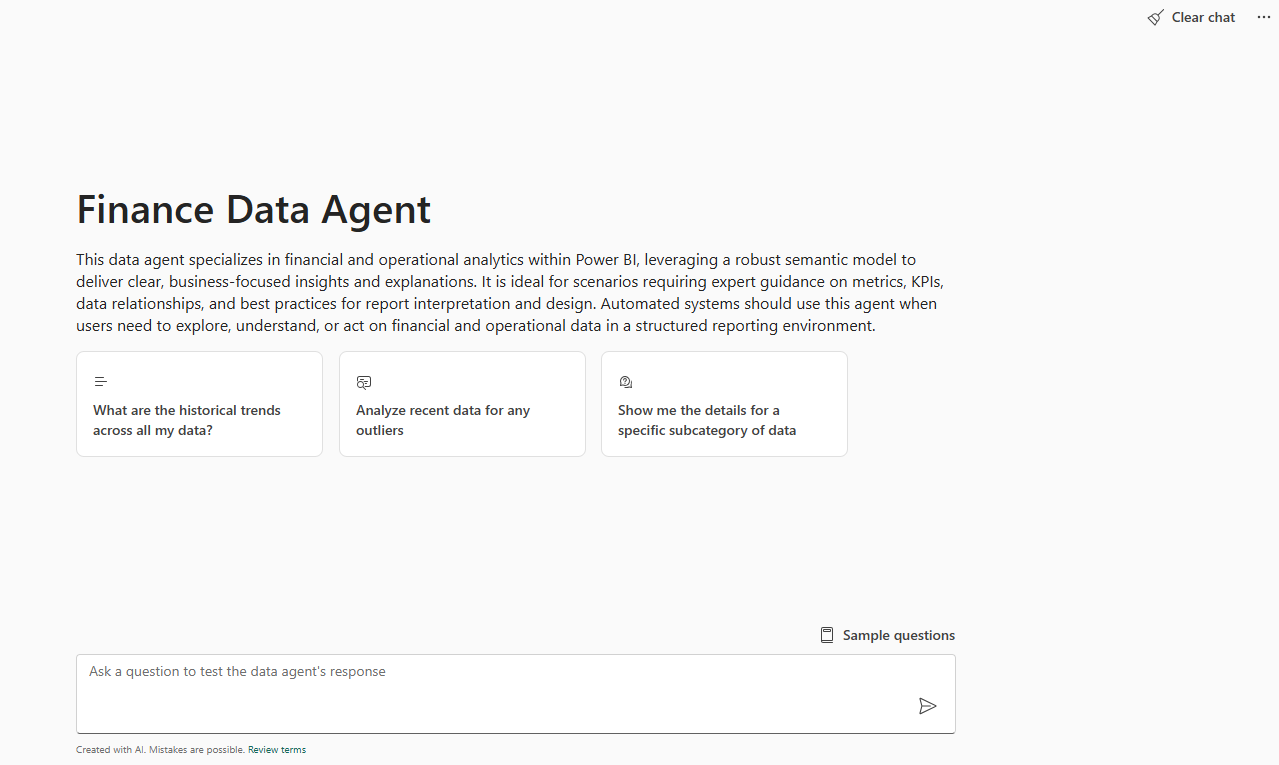
New: AI-powered Data Agents for Analytics for LS Central
We are making available a new set of AI-powered Microsoft Fabric Data Agents built on top of the trusted semantic models used in the standard Power BI reports.
These data agents make it easier to explore and understand your data by allowing users to ask questions in plain language and receive clear, business-focused insights across areas such as Sales, Finance, Inventory, Supply Chain, Hospitality, Hotel, and Bookings.
The agents are designed to:
-
Make analytics more accessible for business users
-
Speed up insights without needing technical knowledge
-
Reuse the same validated data models already delivered with Analytics for LS Central
-
Provide a flexible foundation that can also be extended beyond out-of-the-box usage. These agents can be explored and leveraged technically in advanced scenarios, such as integrating them into Copilot Studio experiences, extending them within Azure AI Foundry, or interacting with them programmatically through APIs. This opens up opportunities to embed them into broader solutions, orchestrate them as part of a master agent, or combine multiple specialized agents into coordinated workflows where they act as sub-agents contributing to more complex decision-making and automation scenarios.
A package folder for automatically generating these agents can be found at our LS Retail Partner Portal for partners and customers interested in creating similar data agents.
Bug fixes
There are no new bug fixes to be communicated in this release.