In this article
All of the report templates have similar navigational aspects, advanced filtering options, and other features such as drill-through to other report pages and drill up and down in visuals. The following description of these different features will help you make the most of our reports.
Navigation and information
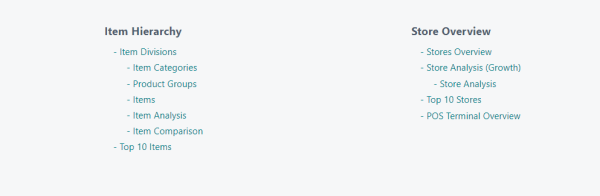
The reports now have a navigation front page where you have an overview of all report pages. The reports are sorted into categories to make it easier to find what you need. If you are customizing reports for different roles within your company, you can easily edit this page as well as hide the reports you do not need before you publish the report to Power BI service. Each report category typically has some overview reports, and then you can drill through to more detailed analysis report pages.
Top bar
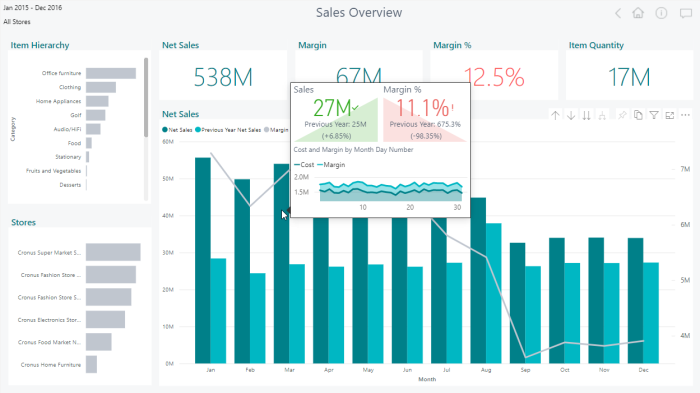
Once you have opened one of the reports, you will see that there is a top section on all report pages. This section has a navigational and informational purpose.

On the left, the time period and locations selected for the report are displayed. All visuals in the report show information for this period and these locations.

In the center, the title of the report is displayed, and if some slicing is being done on the item hierarchy it is displayed below the title. In this example the clothing category has been selected. If you drill through to a more detailed item hierarchy report, some information should always be displayed below the title.

To the right, there are four buttons:
- The first button is the Back button. It takes you back to the report page you were on before you navigated to this one.
- The second is the Home button. It takes you back to the navigation page.
- The third is the Information button. If you hover over it, it displays information about the report page you are on, and if you click the button, it navigates to the Dataset Items report.
- The fourth button invites you to ask a question about your data. This is a powerful feature in Power BI that allows you to ask questions in normal language about using the Analytics data model. This might help you discover information you would like to create report pages for in the future.

Tool tips
Many of the visuals have tool tips with additional information. To see the tool tip, just hover over an object on the visual.
Filtering and slicing
Filter pane
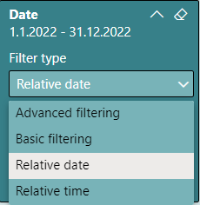
On the right side in every report page there is a Filter Pane where you can filter the data. See the example for Date with a few filter options:
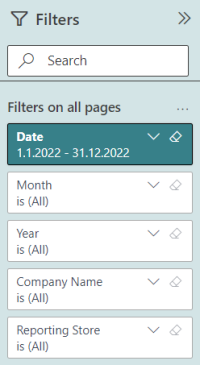
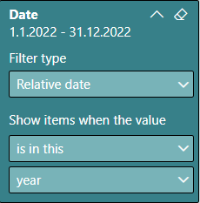
- Advanced filtering – has many options, for example is before x date, is blank, is after.
- Basic filtering – a drop-down list where you can select any of the dates.
- Relative date – dynamic date period, see the date example above which only shows data for this year.
- Relative time – dynamic time period, for example to only show data for a particular hour.
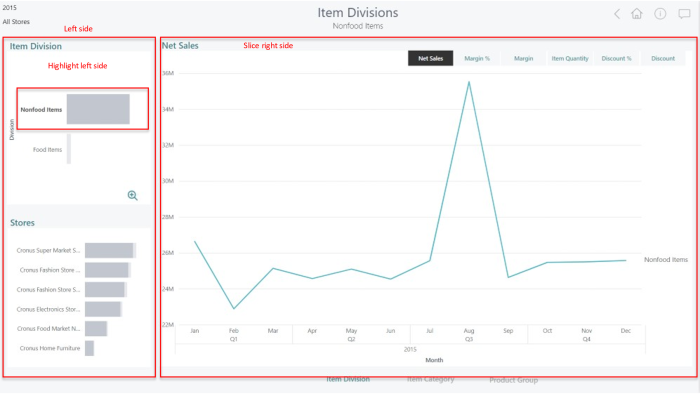
Slicing data using bar charts
The left side bar charts on the report pages are slicers. When you select an object on a bar chart, it will slice the right side of the report and highlight the value in this and other bar charts on the left side.
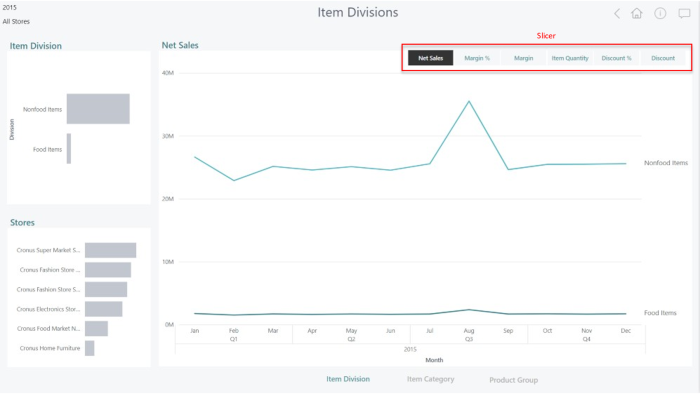
Measure selection
On most report pages there are buttons to switch between the available measures on the page. The measure that is highlighted in black is selected, with one click you can switch between measures and update all visuals on the report page.
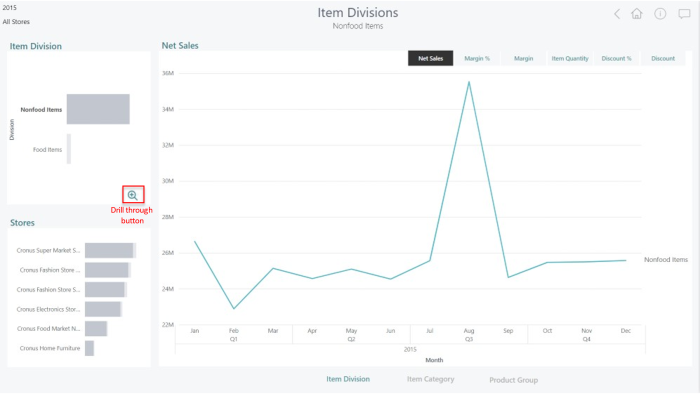
Drill through
When an object has been selected in the report, a drill-through button appears. Hovering over the button displays a description its function.
Tip: You can also select and right-click an object to view the drill-through options.
In the image below, ‘Nonfood Items’ has been selected, and the hover description says "See Item Category details for Nonfood Items". When you click the button, another page called Item Category with Nonfood Items as filter is displayed.
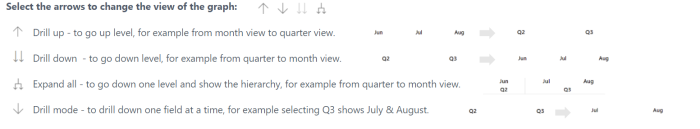
Drill up and down in visuals
Most visuals let you drill up and down when you select the visual on the report page.
This page refers to report templates that are published with Analytics versions 2022.1 and later.