This section describes all visible items in the LS Insight dataset for version 2021.4 and older. From version 2022.1 we provided new report templates and and updated model so we created a new dataset item list.
| Table or measure group | Available in report | Item name | Description and/or origin of data |
|---|---|---|---|
Actuals count |
Sales | AVG Nr of Items per Transaction | AVG Sales per Transaction based on Item Quantity from the source tables.columns (Trans_ Sales Entry.[Quantity], Sales Invoice Line.[Quantity] & Sales Cr_Memo Line.[Quantity]) divided by distinct count of TransactionNo from the source tables (Trans_ Sales Entry.[Transaction No_], Sales Invoice Line.[Document No_] & Sales Cr_Memo Line.[Document No_]) |
| AVG Transaction per Staff | AVG Transaction per Staff based on distinct count of TransactionNo from the source tables (Trans_ Sales Entry.[Transaction No_], Sales Invoice Line.[Document No_] & Sales Cr_Memo Line.[Document No_]) divided by Transacting Staff witch is derived from the source tables.columns (Trans_ Sales Entry.[Transaction No_], Sales Invoice Line.[Document No_] & Sales Cr_Memo Line.[Document No_]) |
||
| Item Quantity | Item Quantity from the source tables.columns (Trans_ Sales Entry.[Quantity], Sales Invoice Line.[Quantity] & Sales Cr_Memo Line.[Quantity]) | ||
Actuals Margin |
Sales | AVG Margin per Item Sold | AVG Margin per Item Sold |
| AVG Margin per Transaction | AVG Margin per Transaction based on distinct count of TransactionNo from the source tables (Trans_ Sales Entry.[Transaction No_], Sales Invoice Line.[Document No_] & Sales Cr_Memo Line.[Document No_]) | ||
| Margin | Margin = [Net Sales] - [Cost] | ||
| Margin % | [Margin] divided by [Net Sales] | ||
Member Management |
Sales | Lost Member | In the Filter page in member filters there is the option to adjust day’s criteria for lost members. The Lost Member measurement is a count of previously active members that have not made any transactions for the day’s criteria. |
|
|
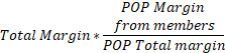
Sales | Margin Increase due to Loyalty Members | Margin amount increase due to loyalty members.
|
|
|
Sales | Margin% Increase due to Loyalty Members | Margin % increase due to loyalty members.
|
|
|
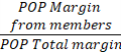
Sales | Member Margin | Margin amount from member transactions |
|
|
Sales | Member Margin % | Margin percentage from member transactions |
|
|
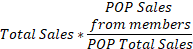
Sales | Member Sales | Sales amount from member transactions |
|
|
Sales | Member Sales ratio | Sales from member transactions as a percentage from total sales for the selected period. |
|
|
Sales | New Member | Count of member transactions for the selected period having no prior transaction history. |
|
|
Sales | Non-Member Sales | Net Sales not linked to a member card |
|
|
Sales | Recovered Members | Count of members that have been declared lost (see definition for Lost Members above) and have returned in the selected period. |
|
|
Sales | Returning Members | Count of member transactions from members with previous transactions in the system |
|
|
Sales | Returning Members % | Percentage of returning members from the total count of members. |
|
|
Sales | Sales Increase due to Loyalty Members | Sales amount increase due to loyalty members.
|
|
|
Sales | Sales New Members | Sales amount to members in the selected period that have no prior sales history. |
Actuals Net Sales |
Sales | AVG Net Sales per Item Sold | AVG Net Sales per Item based on NetSalesAmountLCY from the source tables.columns (Trans_ Sales Entry.[NetAmount], Sales Invoice Line.[NetSalesAmountLCY] & Sales Cr_Memo Line.[NetSalesAmountLCY]) divided by source tables.Columns (Trans_ Sales Entry.[Quantity], Sales Invoice Line.[Quantity] & Sales Cr_Memo Line.[Quantity]) |
| AVG Net Sales per Staff | AVG Net Sales per Staff based on NetSalesAmountLCY from the source tables.columns (Trans_ Sales Entry.[NetAmount], Sales Invoice Line.[NetSalesAmountLCY] & Sales Cr_Memo Line.[NetSalesAmountLCY]) divided by Transacting Staff witch is derived from the source tables.columns (Trans_ Sales Entry.[Transaction No_], Sales Invoice Line.[Document No_] & Sales Cr_Memo Line.[Document No_]) |
||
| AVG Net Sales per Transaction | AVG Sales per Transaction based on NetSalesAmountLCY from the source tables.columns (Trans_ Sales Entry.[NetAmount], Sales Invoice Line.[NetSalesAmountLCY] & Sales Cr_Memo Line.[NetSalesAmountLCY]) divided by distinct count of TransactionNo from the source tables (Trans_ Sales Entry.[Transaction No_], Sales Invoice Line.[Document No_] & Sales Cr_Memo Line.[Document No_]) |
||
| Cost | CostAmountLCY from the source tables (Trans_ Sales Entry.[CostAmount], Sales Invoice Line.[CostAmountLCY] & Sales Cr_Memo Line.[CostAmountLCY]) | ||
| Net Sales | NetSalesAmountLCY from the source tables.columns (Trans_ Sales Entry.[NetAmount], Sales Invoice Line.[NetSalesAmountLCY] & Sales Cr_Memo Line.[NetSalesAmountLCY]) | ||
| Transaction Quantity | Distinct count of TransactionNo from the source tables (Trans_ Sales Entry.[Transaction No_], Sales Invoice Line.[Document No_] & Sales Cr_Memo Line.[Document No_]) | ||
Adjustment |
Inventory | Adjustment | Shows the total adjustments made to item inventory. ([Positive Adjustment] + [Negative Adjustment]) |
|
|
Negative Adjustment | Shows the negative adjustments made to item inventory. | |
|
|
Positive Adjustment | Shows the positive adjustments made to item inventory. | |
Budget dimension |
Sales | Budget Description | [Description] from source table [Retail Sales Budget Name] |
| Budget Name | [Name] from source table [Retail Sales Budget Name] | ||
| Revision | [Revision] from source table [Retail Sales Budget Name] | ||
| Status | [Status] from source table [Retail Sales Budget Name] | ||
Company |
Sales | Company Name | |
Customer |
Sales | Address | Address from source table Customer |
| Address2 | Address2 from source table Customer | ||
| City | City from source table Customer | ||
| Country Region Code | Country Region Code from source table Customer | ||
| County | County from source table Customer | ||
| Credit Limit LCY | Credit limit in local currency [Credit Limit (LCY)] from source table Customer |
||
| Customer Name | [Name] from source table Customer | ||
| Customer No | [No_] from source table Customer | ||
| CustomerNo Name | Concatenated Customer_No and Name from source table Customer | ||
| Payment Terms Code | [Payment Terms Code] from source table Customer | ||
| Post Code | [Post Code] from source table Customer | ||
| Sales Person Code | [Salesperson Code] from source table Customer | ||
| Territory Code | [Territory Code] | ||
Date |
Sales | Current Month | TRUE if month and year in visual is current month and year, else FALSE |
| Sales | Current Quarter | TRUE if Quarter and year in visual is current Quarter and year, else FALSE | |
| Sales | Current Week | TRUE if week and year in visual is current week and year, else FALSE | |
| Sales, Inventory | Date | List of all dates between min and max dates in Sales measure group | |
| Sales | Date Format | Gives the same results as Date, Date in date format | |
| Sales | FY Month | Financial year month based on the assumption that the financial year is June to June | |
| Sales | Is Weekend | TRUE if date in visual is weekend (Saturday or Sunday), else FALSE | |
| Sales, Inventory | Month | Month represented with 3 characters (Jan, Feb, Mar…) | |
| Sales, Inventory | Month Day Number | Integer number representing the day of month | |
| Sales | Month Days | Integer number representing the total days in selected month | |
| Sales, Inventory | Month Number | Integer number representing the month number | |
| Sales, Inventory | Quarter | Quarter number in the format (Q1, Q2, Q3, Q4) | |
| Sales, Inventory | Quarter Day Number | Integer number representing the day of quarter | |
| Sales | Quarter Days | Integer number representing the total days in selected quarter | |
| Sales | QuarterNumber | Decimal number representing the quarter number | |
| Sales | Sequential Day Number | Sequential day number for all dates in date table, less February 29th | |
| Sales | This Year | This year based on the maximum date in the Sales fact table. | |
| Sales, Inventory | Week | Week number in the format W1, W2….W52 | |
| Sales, Inventory | Week Day | Weekday represented with 3 characters (Mon, Tue, Wed…) | |
| Sales, Inventory | Week Day Number | Weekday number, Sunday = 1, Monday = 2 etc. | |
| Sales, Inventory | Week Number | Integer number representing the week number | |
| Sales, Inventory | Year Day Number | Integer number representing the day number of the year (1-365) | |
| Sales | Year Month Number | Sequential decimal number for all months in date table staring with 1 | |
| Sales, Inventory | Year Number | Year in integer format | |
| Sales | Year Quarter Number | Sequential decimal number for all quarters in date table staring with 1 | |
Global Dim 1 |
Sales | Description | [Name] from source table [Dimension Value] where [Global Dimension No_] is equal to 1 |
Global Dim 2 |
Sales | Description | [Name] from source table [Dimension Value] where [Global Dimension No_] is equal to 2 |
Inventory |
Inventory | Closing Inventory | Shows the inventory status (Item count) for each day. If no transactions occur during a period, the last known inventory status is shown. |
|
|
|
Closing Iventory Average Store | Shows the inventory status (Item count) for each day for the average store. |
|
|
Closing Inventory Cost | Shows the inventory cost for each day. If no transactions occur during a period, the last known cost is shown. Total Item cost is the accumulated cost of items over time. For example, 10 items are purchased at unit cost of 2 LCY on day one, and then 5 items are sold but the cost is registered at 1 per unit. The result is Inventory cost of 10*2 - 5*1 = Inventory cost is 15 LCY. |
|
|
|
Closing Inventory Value | Shows the inventory value for each day. If no transactions occur during a period, the last known inventory value is shown. Value is the last known sell price of an item. |
|
|
|
Inventory Margin | Margin is derived by subtracting the Inventory cost from the Value ([Closing Inventory Value] - [Closing Inventory Cost]) |
|
|
|
Inventory Movement | This calculation shows the movement of items from the previous period. Movement is measured in item count. A period can be year, quarter, month, or date. |
|
|
|
Inventory Turnover | Inventory Turnover is a measure of the number of times inventory is sold and replaced during a period. This ratio is calculated by dividing Sales by Closing Inventory for the selected period. | |
|
|
Margin% | Margin% is calculated as ([Value] - [Cost]) / [Value] | |
|
|
Out of Stock Days | Returns a count of items going out of stock. That is, when an item goes from positive count in Inventory to zero or below. |
|
|
|
PP Inventory | Shows the inventory status (Item count) for the previous period. For example, if visual is on a month level, this will show last month. If visual is on a day level, this will show last day. |
|
|
|
PY Closing Inventory Cost | Shows the Inventory cost for the previous year. For example, if you are looking at June for any year, this will show Inventory cost for June in the previous year. | |
|
|
PY Closing Inventory Value | Shows the Inventory value for the previous year. For example, if you are looking at June for any year, this will show Inventory value for June in the previous year. | |
|
|
PY Inventory Margin | Shows the Inventory margin for the previous year. For example, if you are looking at June for any year, this will show Inventory margin for June in the previous year. | |
Item |
Sales, Inventory | Base Unit of Measure | [Base Unit of Measure] from source table [Item] |
| Sales, Inventory | Category | [Description] from the source table [Item Category] | |
| Inventory | Days from Last Sale | Number of days from today to the last sales day for the selected item(s) | |
| Sales, Inventory | Description | [Description] from the source table [Item] | |
| Sales, Inventory | Division | [Description] from source table [Division] | |
| Inventory | First Purchase Date | The first registered day of purchase for the selected item(s) | |
| Inventory | Last Purchase Date | The last registered day of purchase for the selected item(s) | |
| Inventory | Last Sales Date | The last registered day of sale for the selected item(s) | |
| Inventory | Last Sell Price | The last registered sales price for the selected item. NOTE - value only appears for one item. |
|
| Inventory | List of Items | Provides a list of the first 5 item numbers and names, and a count of how many remain. | |
| Sales, Inventory | Inventory Posting Group | [Inventory Posting Group] from source table [Item] | |
| Item Description | Same as Description… | ||
| Job Item Type | NULL… from the source table [Item] | ||
| Sales, Inventory | No & Description | Concatenation of [No_] and Description from the source table [Item] | |
| Sales, Inventory | Product Group | From the source table [Product Group] | |
| Sales Purchase Item Type | [Product Group Code] from the source table [Item] | ||
| Segments | 5 Clusters for Segmentation over Margin and Nr of Items | ||
| Standard Cost | [Standard Cost] from the source table [Item] | ||
| Unit Cost | [Unit Cost] from the source table [Item] | ||
| Vendor Item No | [Vendor Item No_] from the source table [Item] | ||
| Vendor & No | [Vendor No_] from the source table [Item] | ||
Item Category |
Sales | Code | [Code] from source table [Item Category] |
| Description | [Description] from source table [Item Category] | ||
| Division Code | [Division Code] from source table [Item Category] | ||
Item Variant |
Inventory | Code | Item variant code |
|
|
Description | Item variant description | |
|
|
Description 2 | Item variant secondary description | |
Location |
Sales, Inventory | City | City of location |
|
|
Sales, Inventory | Country Code | Country code of location |
|
|
Sales, Inventory | County | County of location |
|
|
Sales, Inventory | Latitude | Latitude of location |
|
|
Sales, Inventory | List of Location Code | Provides a list of the first 5 location numbers and a count of how many remain. |
|
|
Sales, Inventory | List of Locations | Provides a list of the first 5 location names and a count of how many remain. |
|
|
Sales, Inventory | Location Code | Location code |
|
|
Sales, Inventory | Location Hierarchy | Provides a hierarchy: Store Name -> Location Name (a store can have multiple locations). |
|
|
Sales, Inventory | Location Name | The name of the location. |
|
|
Sales, Inventory | Longitude | The longitude of the locations. |
|
|
Sales, Inventory | Postcode | The postcode of the locations. |
|
|
Sales, Inventory | Reporting Store | This is the logical store name for one or more locations. Could also be a single store or location. |
|
|
Sales, Inventory | Reporting Store ID | This is the logical store ID for one or more locations. Could also be a single store or location ID. |
KPI's targets |
Sales | POP Target Growth % | Period over Period % growth |
|
|
POP Target Growth | Period over Period growth | |
POP Margin |
Sales | MOMTD Margin | Margin change from previous month |
|
|
POP Margin | Period Over Period margin (automatically selects year, quarter, or month) | |
|
|
POP% Margin | Period Over Period % margin (automatically selects year, quarter, or month) | |
|
|
QOQ Margin | Quarter Over Quarter margin | |
|
|
QOQTD Margin | Quarter Over Quarter To Date margin | |
|
|
YOY Margin | Year Over Year margin | |
|
|
YOYTD Margin | Year Over Year To Date margin | |
POP Net Sales |
POP AVG Net Sales per Staff | POP AVG Net Sales per Staff | |
|
|
POP AVG Net Sales per Transaction | POP AVG Net Sales per Transaction | |
|
|
POP net sales | Period Over Period Net Sales (automatically selects year, quarter, or month) | |
|
|
POP% net sales |
Period Over Period % Net Sales (automatically selects year, quarter, or month) | |
|
|
QOQ net sales | Quarter Over Quarter Net Sales | |
|
|
QOQTD net sales | Quarter Over Quarter To Date Net Sales | |
|
|
YOY net sales | Year Over Year Net Sales | |
|
|
YOYTD net sales | Year Over Year To Date Net Sales | |
POS Terminal |
Sales | Description | [Description] from source table [POS Terminal] |
| PP counts | Sales | PM Transacting Staff | LM Transacting Staff |
|
|
PM Transaction Quantity | LM Transaction Quantity | |
| PP AVG Transaction per Staff | LP AVG Transaction per Staff | ||
| PP Transacting Staff | LP Transacting Staff | ||
| PP Transaction Quantity | LP Transaction Quantity | ||
| PY AVG Transaction per Staff | LY AVG Transaction per Staff | ||
| PY Transacting Staff | LY Transacting Staff | ||
| PY Transaction Quantity | LY Transaction Quantity | ||
PP Margin |
Sales | PMTD Margin | Last months margin from start of month to the parallel date from current month (e.g. If today is marsh 15th, the margin is given for the period April 1st to April 15th) |
| PP Margin | Last Period Margin. Switches between LM, LQ and LY Margin | ||
| PQTD Margin | Last quarter margin from start of quarter to the parallel date from current quarter (e.g. If today is may 15th, the margin is given for the period January 1st to February 15th) |
||
| PYTD Margin | Last year margin from start of year to the parallel date from current year (e.g. If today is may 15th, the margin is given for the period January 1st to May 15th last year) |
||
| PP Net Sales | Sales | PM AVG Net Sales per Staff | LM AVG Net Sales per Staff |
| PM AVG Net Sales per Transaction | LM AVG Net Sales per Transaction | ||
| PM AVG Transaction per Staff | LM AVG Transaction per Staff | ||
| PP AVG Net Sales per Staff | LP AVG Net Sales per Staff | ||
|
|
PP AVG Net Sales per Transaction | LP AVG Net Sales per Transaction | |
|
|
PY AVG Net Sales per Staff | LY AVG Net Sales per Staff | |
| PY AVG Net Sales per Transaction | LY AVG Net Sales per Transaction | ||
| PMTD net sales | Last months Net Sales from start of month to the parallel date from current month (e.g. If today is marsh 15th, Net Sales is given for the period April 1st to April 15th) |
||
| PP net sales | Last Period Net Sales. Switches between LM, LQ and LY Net Sales | ||
| PQTD net sales | Last quarter Net Sales from start of quarter to the parallel date from current quarter (e.g. If today is may 15th, Net Sales is given for the period January 1st to February 15th) |
||
| PYTD net sales | Last year Net Sales from start of year to the parallel date from current year (e.g. If today is may 15th, the Net Sales is given for the period January 1st to May 15th last year) |
||
| PP net sales | Previous Period Net Sales (automatically selects year, quarter, or month) | ||
| Purchases | Inventory | Purchase Quantity | Shows the purchase quantity (Item count) for the selected period. |
|
|
Purchase Return Quantity | Shows the number of items returned to vendors. NOTE - View with reason description to get more details. |
|
| Purchase Return Rate | Shows the percentile of items returned to vendors. NOTE - View with reason description to get more details. |
||
| PY Purchase Return | Shows the number of items returned to vendors the previous year (12 months prior to selection). | ||
| Reason Codes | Inventory | Code | Reason codes, for purchase returns and sales returns. |
|
|
Description | Reason codes, for purchase returns and sales returns. | |
| List of Reasons | Provides a list of the first 5 Reason descriptions and a count of how many remain. | ||
| Sales | Inventory | PY Return Quantity | Shows the number of sold items returned the previous year (12 months prior to selection). NOTE - View with reason description to get more details. |
| PY Sales Quantity | Shows the number of items sold the previous year (12 months prior to selection). | ||
| Return Quantity | Shows the number of sold items that have been returned. NOTE - View with reason description to get more details. |
||
| Return Rate | Shows the percentile of sold items that have been returned. NOTE - View with reason description to get more details. |
||
| Sales Quantity | Shows the number of items sold (item count). | ||
| Through Return rate | This is the ratio between Sales returns and Purchase returns to vendors. ([Purchase Return Rate] / [Return Rate ]) |
||
| Sales Budget | Sales | Budget Amount | Column [Amount] from Retail Sales Budget Entry] in source data with default aggregate set to SUM |
| Closing Stock Value | [Closing Stock Value] from Retail Sales Budget Entry] in source data with default aggregate set to SUM | ||
| Code | [Code] from Retail Sales Budget Entry] in source data | ||
| Cost Amount | [Cost Amount] from Retail Sales Budget Entry] in source data with default aggregate set to SUM | ||
|
|
CY Budget | Budget sum for Current year ( This needs looking into as Current year is set as Max year - 1) | |
|
|
Discount Amount | [Discount Amount] from Retail Sales Budget Entry] in source data with default aggregate set to SUM | |
|
|
Negative Adjustment Amount | [Negative Adjustment Amount] from Retail Sales Budget Entry] in source data with default aggregate set to SUM | |
|
|
Opening Stock Value | [Opening Stock Value] from Retail Sales Budget Entry] in source data with default aggregate set to SUM | |
|
|
Quantity | [Quantity] from Retail Sales Budget Entry] in source data with default aggregate set to SUM | |
|
|
Revision | [Revision] from Retail Sales Budget Entry] in source data with default aggregate set to SUM | |
|
|
UserID | [User ID] from Retail Sales Budget Entry] in source data | |
Staff |
Sales | First Name | First name of Staff member. Can either be [First Name] from source table [staff] or first name from [Name] in source table [Salesperson_Purchaser] |
|
|
ID | ID of Staff member. Can either be [ID] from source table [staff] or [Code] from source table [Salesperson_Purchaser] |
|
|
|
Last Name | Last name of Staff member. Can either be [Last Name] from source table [staff] or last name from [Name] in source table [Salesperson_Purchaser] |
|
|
|
Staff | Staff = Staff[LastName] | |
|
|
Transacting Staff | Calculated measure showing the distinct count of transacting staff | |
Store |
Sales | City | [City] from source table [Store] |
|
|
Country Code | [Post Code] from source table [Store] | |
| County | [County] from source table [Store] | ||
| Location Code | [Location Code] from source table [Store] | ||
| Post Code | [Post Code] from source table [Store] | ||
| Store Name = Store[StoreName] | |||
| Store Name | [Name] from source table [Store] | ||
| Supply | Inventory | AVG Days of Supply | Average days of supply in the filtered period. |
| AVG Sales Last X Days | Calculates the average sales in the last number of days based on the What If parameter "Number of days". | ||
| AVG Sales Last X Weeks | Calculates the average sales in the last number of weeks based on the What If parameter "Number of weeks". | ||
| AVG Weeks of Supply | The average weeks of supply in the filtered period. | ||
| Bottom 10 | The 10 items you have the fewest [days of supply] left. | ||
|
|
Days of Supply | Measures the average number of days the company holds its inventory before selling it. | |
| Item Supply Rank ASC | Items ranked with the lowest days of supply. Filtered on items with days of supply greater than 0. | ||
| Item Supply Rank DESC | Items ranked with the highest days of supply. | ||
| Top 10 | The 10 items you have the most [days of supply]. | ||
| Weeks of Supply | Measures the average number of weeks the company holds its inventory before selling it. | ||
TD Margin |
Sales | MTD Margin | Month To Date margin |
| QTD Margin | Quarter To Date margin | ||
| YTD Margin | Year To Date margin | ||
| TD Net Sales | Sales | MOMTD net sales | Net Sales change from previous month |
| MTD net sales | Month To Date Net Sales | ||
| QTD net sales | Quarter To Date Net Sales | ||
| YTD net sales | Year To Date Net Sales | ||
|
|
YTD Days | Count of YTD days | |
Time |
Sales | AMPM | Text, either AM or PM |
|
|
Hour12 | Hour 00 - 12 | |
|
|
Hour24 | Hour 00 - 23 | |
|
|
Minute | Minute 00 - 59 | |
|
|
Second | Second 00 - 59 | |
|
|
Time | Time in the format hh:mm:ss | |
Vendor |
Inventory | Address | Registered address for vendors |
|
|
Blocked | Blocked code 1 = Payment 2 = All |
|
|
|
City | City of vendor | |
|
|
Country Code | Vendor’s country code. | |
| County | Vendor’s county. | ||
| Currency Code | Vendor’s currency code. | ||
|
|
Language Code | Vendor’s language. | |
| Post Code | Vendor’s post code. | ||
| Vendor Name | Vendor’s name. | ||
| Vendor No | Vendor’s number in the NAV system. | ||
| Vendor No&Name | Vendor’s number and name combined. |