About This Release
Released - Feb 9th 2026
In this version of Analytics for LS Central Analytics (bc2adls based) was tested and refined, and it is now no longer in BETA. There is no update path from the BETA to this new version so we recommend creating a new Analytics environment using version 2026.1 to replace the BETA version.
Performance testing of the Analytics (bc2adls based), has yielded very promising results both cost and time wise in comparison to earlier versions. Especially for customers with high data volume and multiple companies.
Note: The cost calculator was updated to reflect this.
Since our hospitality team is working on a new Tips functionality, in this release new operational Income and Expense accounts data warehouse tables were added. Also, new report pages were added and respective semantic models updated for Sales and Hospitality reports.
Note: Find out more about it at the Reports section in this article.
Tables, procedures and pipelines were added in preparation for adding Hierarchy nodes to Sales budget reports in the next version.
This version of Analytics supports versions 19.0 and later of LS Central On-premises and later versions of LS Central SaaS. Setup of Analytics for LS Central SaaS needs some additional setup from the standard Analytics onboarding process and is explained in detail in the onboarding documentation.
If you have older versions of LS Central or NAV, some parts of Analytics data warehouse and reports might run, but some of the ETL pipelines will fail to run because of missing tables and columns. We have therefore created a special page in the online help where you can learn more about partial loading of the data warehouse.
Note: Updates for Analytics (classic) version 2025.2 are provided in a special update package. If you have already set up version 2025.2, you can update to 2026.1 without creating a new instance of Analytics. See update guidelines for more information.
Note: If you have customizations in your Analytics instance, you need to make sure before you start that the updates do not affect these customizations.
The following is a list of changes and key features in Analytics version 2026.1.
New or Enhanced Features
Analytics (bc2adls based)
Analytics (bc2adls based) has now been released. The new process that was previously released in BETA was refined and released as Analytics (bc2adls based). Analytics for LS Central that supports the older onboarding scenarios will be referred to as Analytics (classic). Analytics (bc2adls based) uses data exported from LS Central to an Azure storage account, using the BC2ADLS app, as the source for Analytics for LS Central.
The biggest changes between the BETA version and this release are:
- Initialize process moved from PowerShell script to Analytics Azure data factory
- Azure data factory was modified to support only Analytics (bc2adls based) deployment.
- Bugfix: Date and time columns not created correctly in staging tables in the Analytics (bc2adls based) BETA.
Analytics (bc2adls based) only requires installation and configuration of the BC2ADLS app in your LS Central environment and a creation of a storage account and container in Azure. So no on-premises server or LS Central setup is needed.
Even though Analytics (bc2adls based) is primarily designed for our LS Central SaaS customers it can also be utilized by on-premise customers that want to control the access to their LS Central server.
The package can be downloaded by filling out the regular the Request product package form that you get a link to when you apply for an Analytics license and in the form you select the New installation - bc2adls based option. Once you have submitted the form you receive a download package with a special deployment script and a link to the new onboarding scenario wizard.
Note: This setup package can not be used to update older versions of Analytics (classic) or the Analytics (bc2adls based) BETA that was released with the last version of Analytics. A new environment must be created.
Analytics deployment options – current and future direction
After the release of Analytics (bc2adls based) we currently offer Analytics in two deployment models, depending on how data is sourced from LS Central:
Analytics (classic)
This version uses data sourced from:
- LS Central on-premises, or
- Pre-staging tables populated via Data Director and replication.
This deployment model will continue to be supported for existing customers.
Analytics (bc2adls-based)
This newer version uses data exported from LS Central SaaS via the bc2adls app to Azure Data Lake Storage.
It is designed to better support:
- LS Central SaaS environments
- Modern Azure and Fabric-based Analytics scenarios
- Ongoing improvements to the data warehouse and reports.
What this means going forward
Starting with this release:
- All improvements to the data warehouse and reports are available in both deployment models.
- This will continue for one additional release.
After that:
- New data warehouse tables, report enhancements, and analytics features will be delivered only to the bc2adls-based Analytics
- The classic Analytics deployment will:
- Remain supported
- Continue to receive fixes and maintenance
- Not receive new data warehouse structures or reports
Our recommendation
For customers planning new Analytics initiatives or future expansions, we recommend using the bc2adls-based Analytics, as this is where all ongoing innovation will happen.
Setup
Product package
Prestaging table creation scripts
Prestaging scripts were added, for the following LS Central tables:
- LSC Income_Expense Account
- LSC Trans_ Inc__Exp_ Entry
- LSC Hierar_ Nodes
- LSC Hierar_ Node Link
Scheduler job header file
The Scheduler header file was updated to include subjobs for the new prestaging tables:
- LSC Income_Expense Account
- LSC Trans_ Inc__Exp_ Entry
- LSC Hierar_ Nodes
- LSC Hierar_ Node Link
Documentation
Onboarding documentation for Analytics (bc2adls based) was updated.
Cost components and calculator has been updated with cost calculations for Analytics (bc2adls based).
New extension guide for Analytics (bc2adls based) has been added to extension page.
Analytics and Excel page has been added to Report section.
Azure Data Factory
Pipelines
Changes in pipelines (classic and bc2adls based)
Two new pipelines were added to 3-Modules > Fact Tables folder in the Data Factory
- Base factIncomeExpense
- Base bridgeHierarchyNodeLink
Changes in pipelines (bc2adls based only)
Populate Query base and Factory reset
Analytics (bc2adls based) has new versions of the Populate Query base and Factory reset pipelines.
The Populate Query Base pipeline runs a dataflow that gets the json metadata from the cdm.json files in the storage account and parses that into a new table, Analytics$JsonMetadata. Then a new procedure, AnalyticsParseCdmJson, that reads the new table and creates the data for the AnalyticsBC2ADLSMetadata table.
The Factory reset pipeline starts by running the new Populate Query Base pipeline to get new metadata. Then it executes the same stored procedure as before to reset the data warehouse. The procedure, Analytics$ResetDW, has been changed a little bit. The procedure has removed the old logic that dropped the staging tables and instead executes a new procedure, AnalyticsRecreateStaging, that recreates all staging and prestaging tables. Then finally it triggers the Scheduled run pipeline.
Before running the Factory reset pipeline you will need to reset all the tables in the bc2adls extension in BC. If any of the table definitions have changed you must first run a Schema export to get the latest metadata and then reset all the tables and run an export. Once the export has finished you should trigger the Factory reset pipeline.
Index creation pipeline
A new procedure named AnalyticsCreateStagingIndexes was added to the database. It takes in a parameter of minimum number of rows and creates an index on the columns in the primary key and the bigint_timestamp in all staging tables that have more rows than the input parameter.
There is also a new pipeline named Create Staging Indexes that executes this procedure with a default value of 100.000 for the minimum row count. Pipeline is safe to run multiple times, it will check for existing indexes and skip tables if the index already exists on the same columns.
It is recommended that this pipeline is run after the Initial load to create indexes to help performance. You should also create a weekly trigger for the Database Maintenance pipeline to keep the indexes efficient and statistics up to date.
Data Warehouse
Database
Tables
Tables were added to the data warehouse for Income/Expense update and also in preparation for adding Hierarchy Budgets to the data warehouse and reports in the next version (2026.2).
Two new dimension tables were added:
- dIncExpAccount
- dHierarchyNode
New columns were added to dSalesBudget dimension.
One new bridge table was added:
- bHierarchyNodeLinks
One new fact table was added using the listed staging tables:
- fIncomeExpense
Stored procedures
Three new stored procedures were added for loading of data to the new dimension tables:
- dimMergedIncExpAccount
- dimMergedHierarchyNodeExec
- v27dimMergedHierarchyNode
Three new stored procedures were added for loading of data to the new fact tables and bridge table:
- factIncomeExpense
Code to populate CustomerNo column was added to v25dimMergedMember stored procedure.
A new procedure named AnalyticsCreateStagingIndexes was added to the database. It takes in a parameter of minimum number of rows and creates an index on the columns in the primary key and the bigint_timestamp in all staging tables that have more rows than the input parameter.
Reports
Report Updates
Sales Analytics
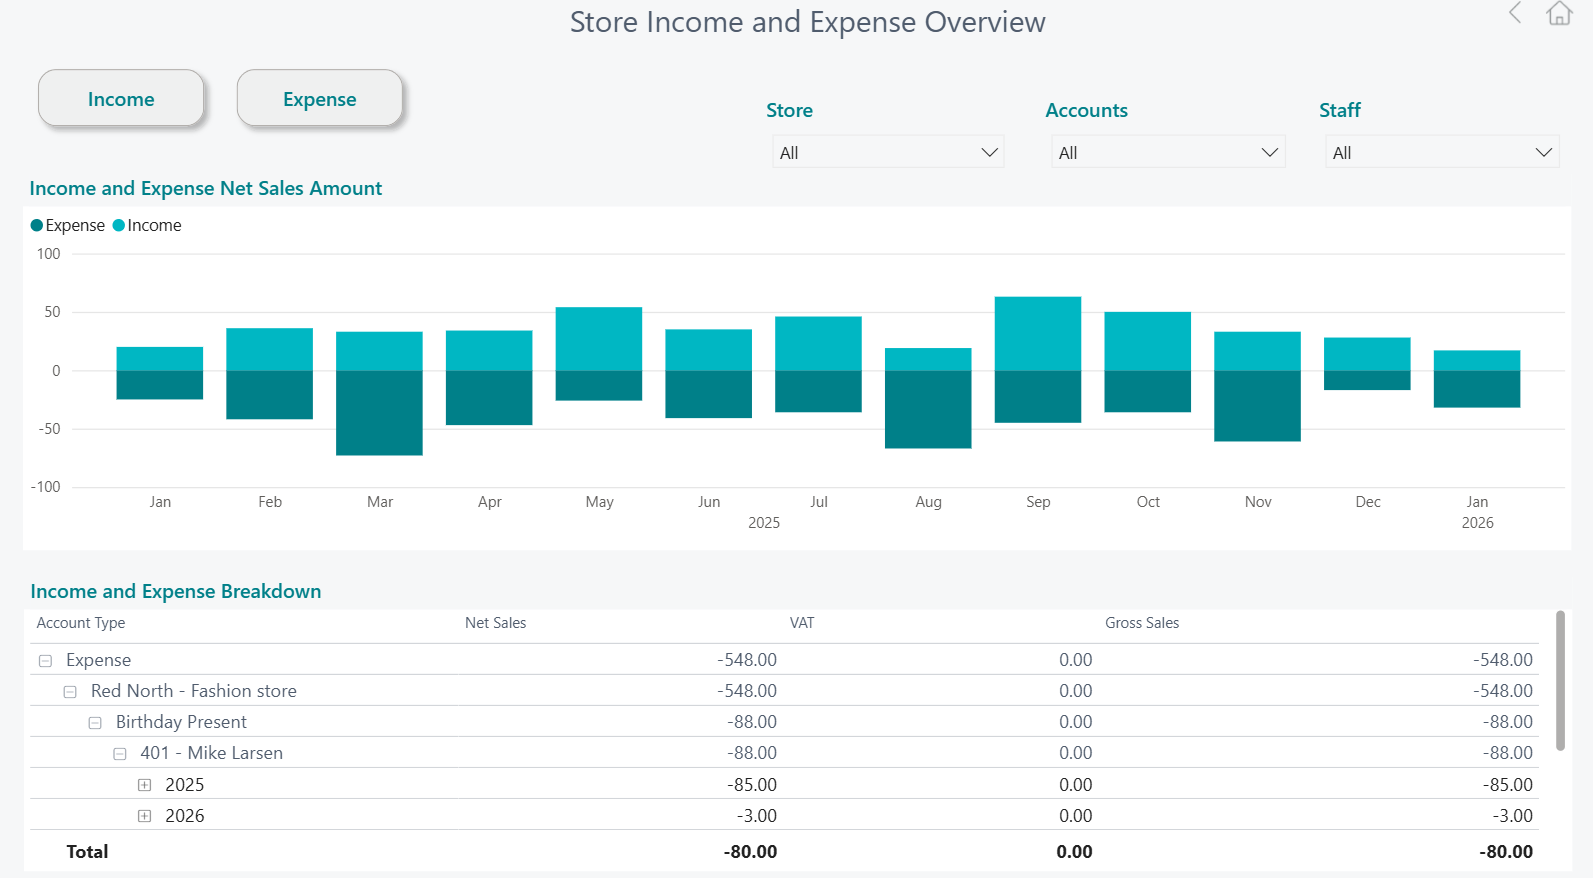
New Store Income and Expense Overview report page
The Store Income and Expense Overview report page focuses specifically on store level operational income and costs, such as cleaning, maintenance, and other running expenses, alongside non‑sales income like gift cards, tips, and miscellaneous store revenue. The monthly view makes it easy to see how these operational inflows and outflows evolve over time, with filters that allow users to analyze results by store, account, or staff.
The detailed breakdown below the chart helps managers understand exactly where operational costs are coming from and how much supplemental income the store generates beyond core sales. This insight supports better cost control, clearer budgeting for store operations, and more informed decisions about improving efficiency and maximizing overall store contribution.
Hospitality Analytics
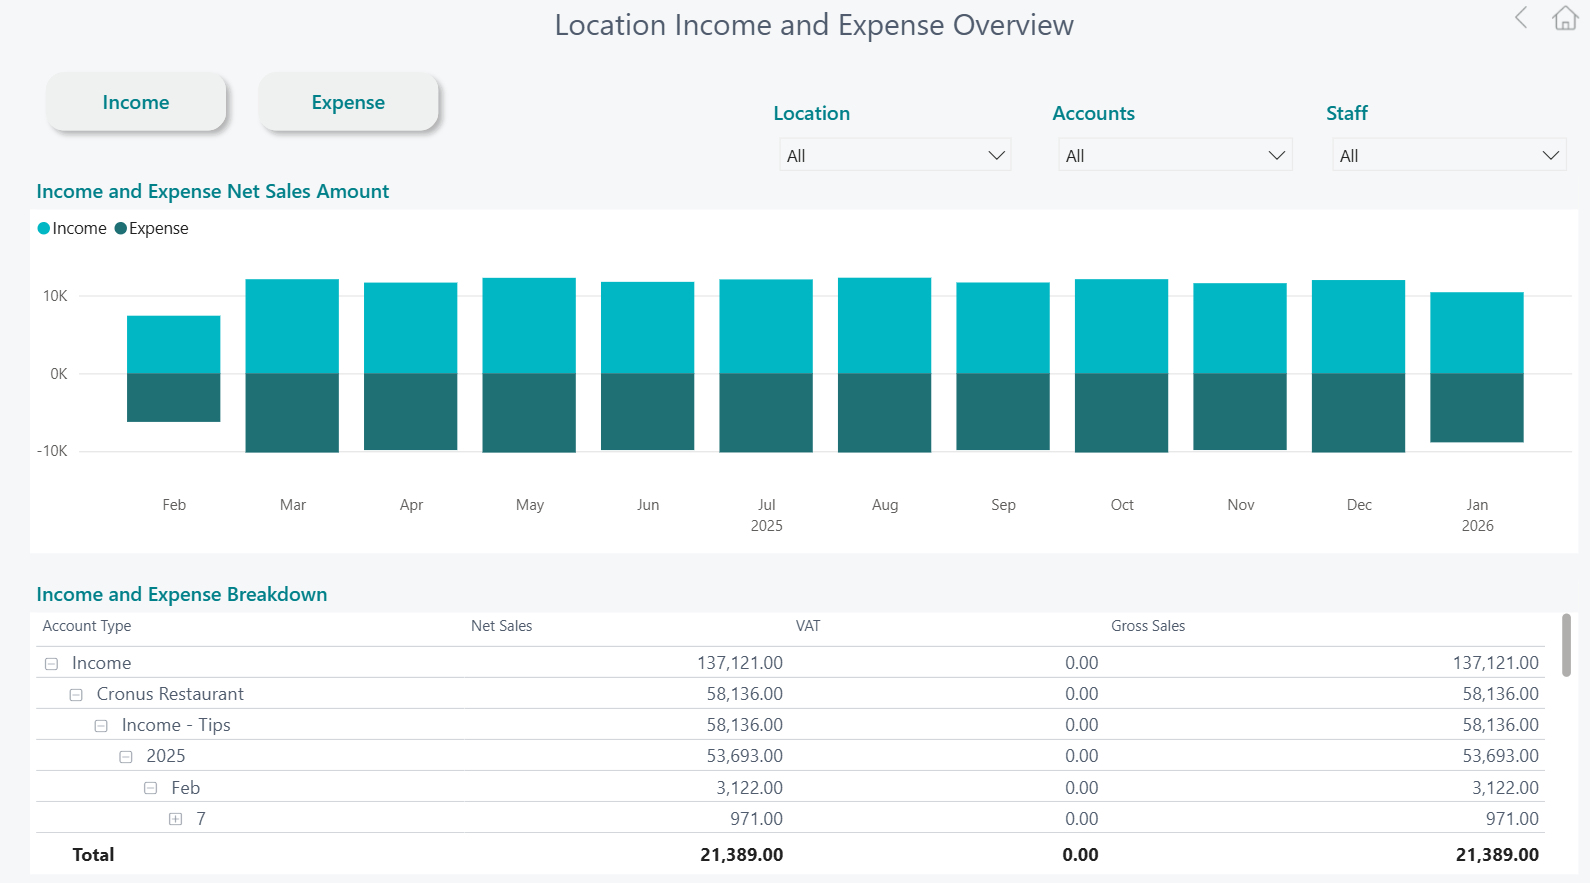
New Location Income and Expense Overview report page
This Location Income and Expense Overview page provides hospitality operators with a clear monthly view of operational level income and costs across restaurants, cafés, and quick‑service different locations. It highlights non‑sales income such as tips, service-related income, or adjustments alongside day‑to‑day operational expenses like cleaning, maintenance, and other location-specific costs, with filters that allow quick analysis by location, account, or staff.
New Gratuity overview report page
This Gratuity Overview report page brings together key tip metrics—such as tips in, tips out, weekly averages, and tips as a share of net sales—to help hospitality operators understand how gratuities evolve across restaurants, cafés, and quick‑service locations. The visual trends make it easy to track changes over time and compare performance by location or staff.
With a detailed breakdown by date and location, the dashboard supports transparency and consistency in tip handling. It helps managers spot anomalies, validate fair distribution, and better understand the relationship between guest behavior, staff engagement, and overall operational performance.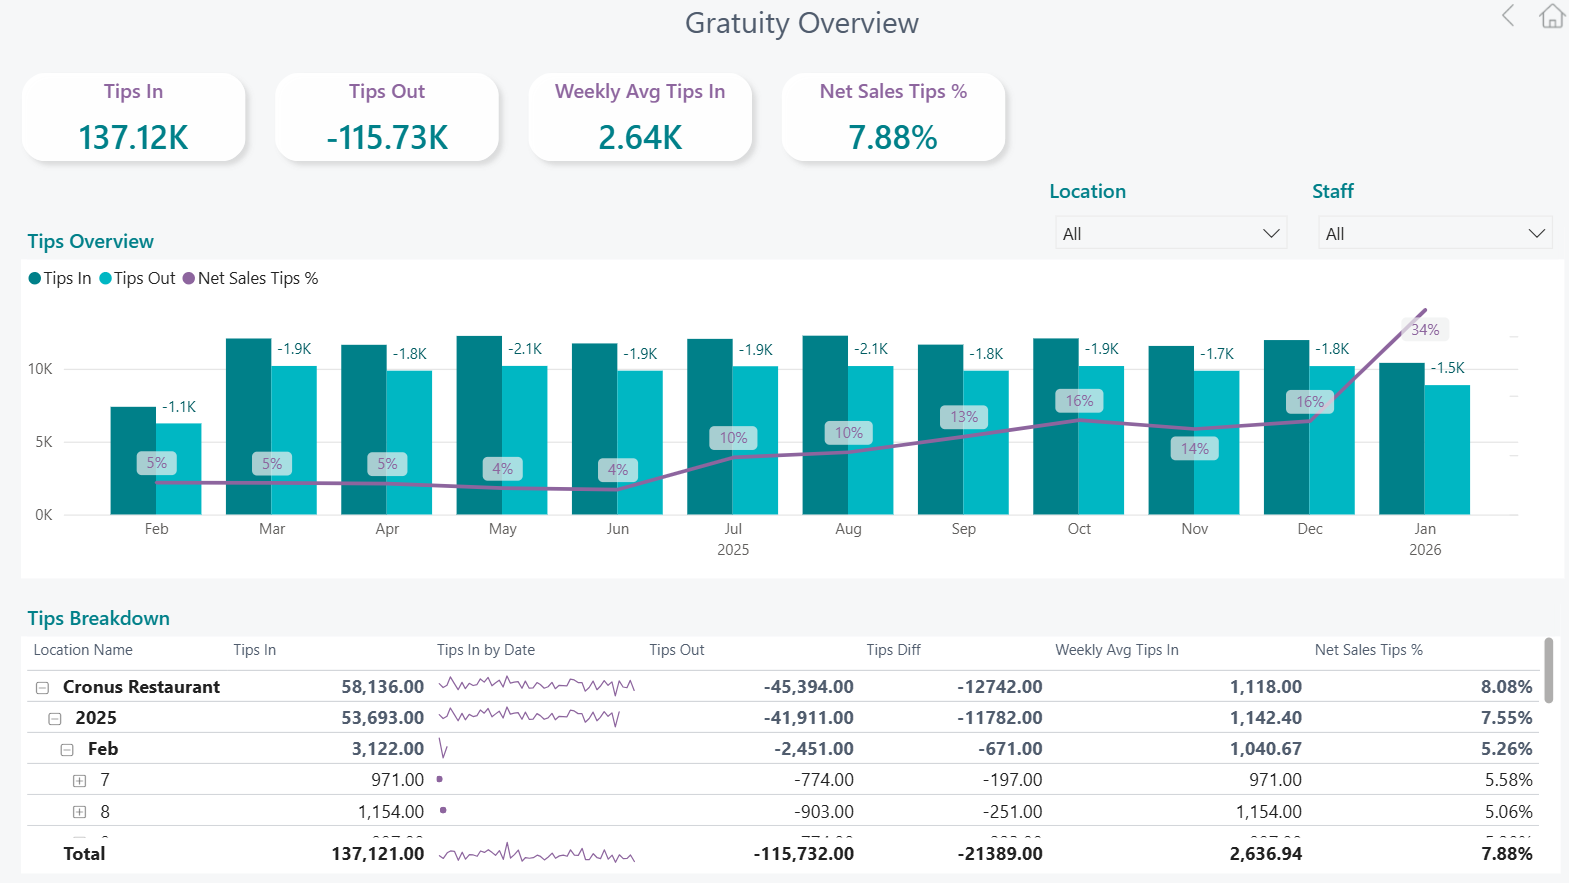
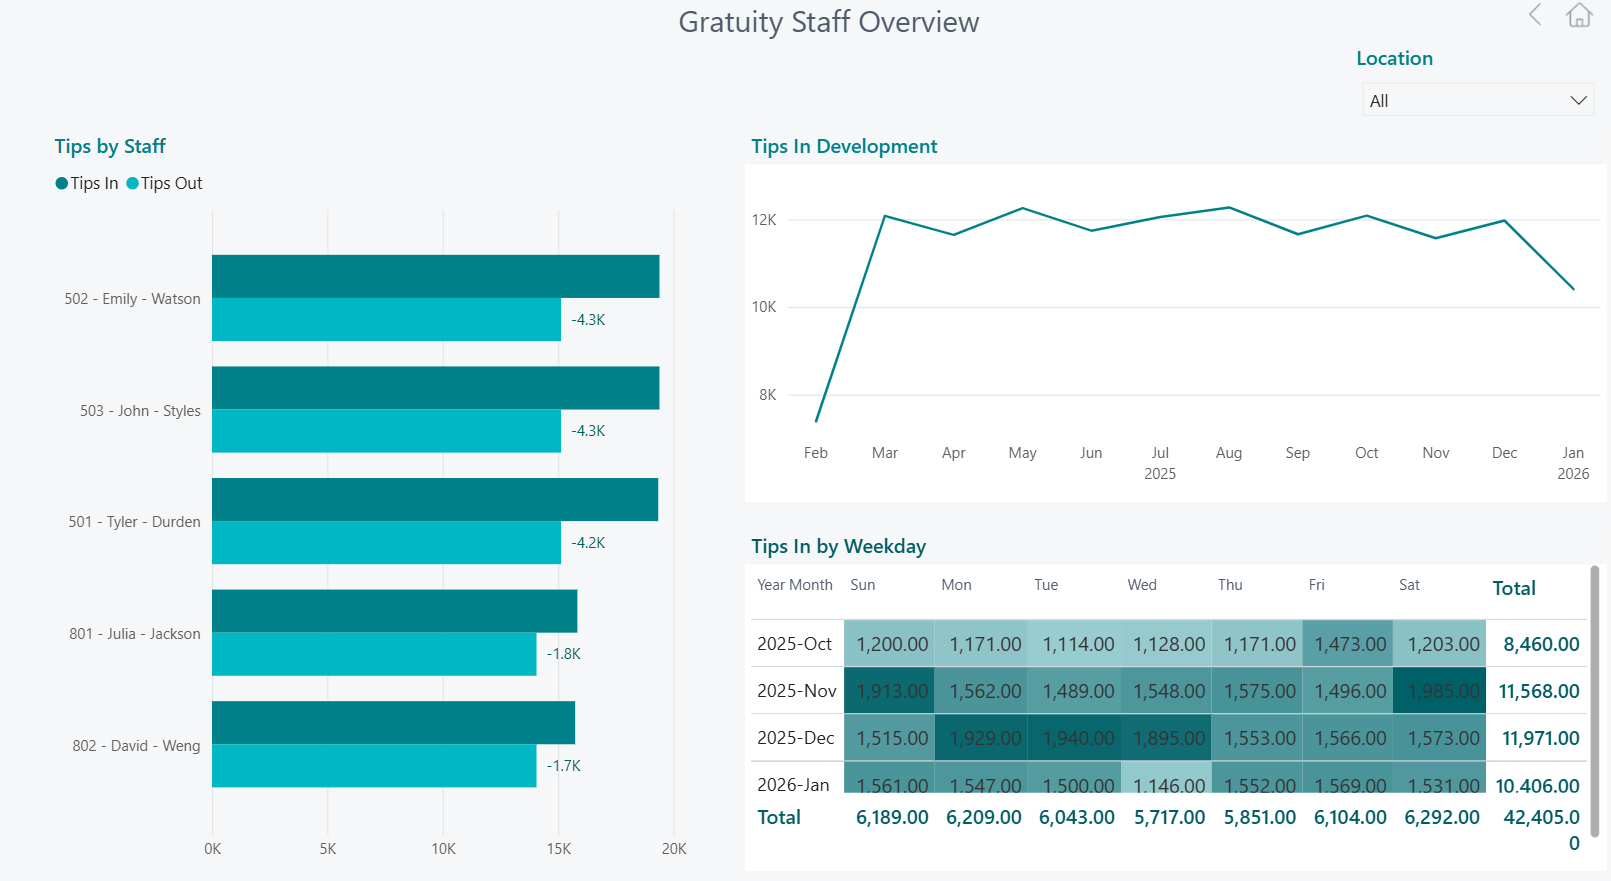
New Gratuity Staff Overview report page
This Gratuity Staff Overview page focuses on how tips are distributed and earned at an individual staff level across hospitality locations. It highlights tips in and tips out by employee, showing relative contribution and payout patterns, while the trend view tracks how overall tips develop over time.
By combining staff comparisons with weekday and monthly patterns, the dashboard helps managers understand peak tipping periods, balance workloads, and ensure gratuities are allocated fairly. This insight supports transparent tip management, improved staffing decisions, and a stronger link between staff engagement, service quality, and guest experience.
Note: This new report pages underlying procedures, tables, columns and measures are subsequently reflected at the updated Data Catalog.
Bug fixes
Data warehouse
Added -1 multiplier to SIL Cost Amount caluculations in factSalesPosted stored procedure